Business Area Square Diagram – Clear Visualization of Business Sectors
RJ0300061_9
- Last Update 05/05/2025
- File Size 0.2MB
- # of Slides 2
- File Format PPTX
- Slide Ratio 16:9
- Color
Keywords
- #Content-Based Slides
- #Design-Based Slides
- #Company Introduction
- #Business Introduction
- #Diagram
- #Business Areas
- #Business Areas
- #Spread
- #16:9
- #business area diagram PowerPoint
- #4-quadrant square diagram slide
- #business sector visualization template
- #company business portfolio slide
- #how to create a business area diagram in PowerPoint
About the Product
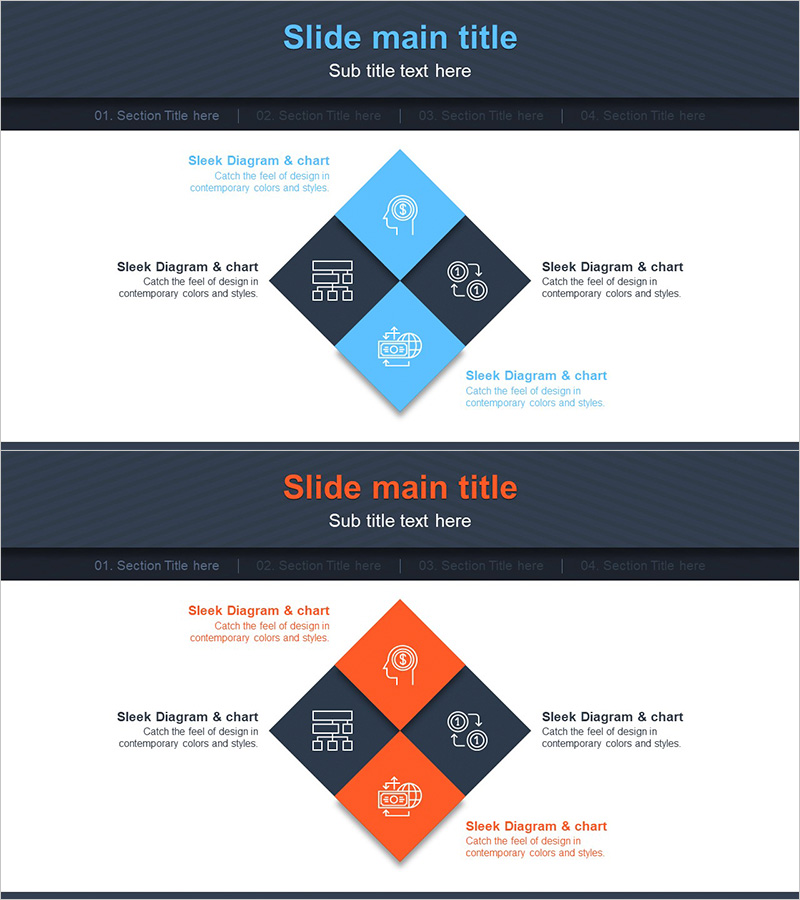
A PowerPoint slide that clearly visualizes business sectors across four quadrants using a diamond-shaped diagram. Each business area is represented with icons and text labels, while the blue and orange two-tone color scheme creates strong visual contrast and enhances information clarity. Ideal for company profile presentations and business overview decks where you need to showcase your business portfolio. All text and icons are fully editable, allowing you to customize each quadrant to match your specific business divisions. This 16:9 widescreen slide set includes two layout variations for flexible presentation use.
Usage Points
-
Main Usage
Clearly present multiple business divisions by organizing them into four distinct quadrants. Each quadrant features an icon and text area to communicate the characteristics and role of each business sector. This layout effectively demonstrates business portfolio diversity and balance to investors, partners, and clients.
-
How to Use
Use this slide in the business sectors section of company presentations or business overview decks. Simply replace the placeholder text with your actual business division names and swap the icons to match your industry categories. During presentations, you can explain each quadrant sequentially or display the entire business structure at once.
-
Recommended For
Ideal for executives, business development teams, and marketing departments presenting corporate business portfolios. Particularly effective for diversified enterprises or conglomerates that need to clearly differentiate multiple business lines. Works well in investor presentations, partnership pitches, and corporate overview meetings.
-
Slide Structure
Diamond-shaped layout with four quadrants: two blue squares (top and bottom) and two dark gray squares (left and right). Each quadrant contains an icon placeholder and text input area. Additional descriptive text can be added above and below the main diagram. The two-slide set provides both blue-tone and orange-tone color variations for presentation flexibility.
Related Products
-

Management Business Area Diagram – Effective Business Introduction
#Company Introduction #Business Introduction #Diagram
-

Diffusion Graph without Business Focus – Flexible Business Presentation
#Company Introduction #Business Introduction #Diagram
-

Financial Management Services Area Diagram – Visualizing Business Areas
#Company Introduction #Business Introduction #Diagram
-

Hexagonal Diffusion Diagram for Business Area Visualization
#Company Introduction #Business Introduction #Diagram
