Target Country Analysis Bar Graph – Insights into Global Markets
RJ0300061_26
- Last Update 05/05/2025
- File Size 0.6MB
- # of Slides 2
- File Format PPTX
- Slide Ratio 16:9
- Color
Keywords
- #Content-Based Slides
- #Design-Based Slides
- #Company Introduction
- #Market and Competitor Analysis
- #Graph
- #Other
- #Global Network
- #Market Analysis
- #Column
- #Column Chart
- #Map
- #16:9
- #world map PowerPoint slide
- #regional analysis presentation
- #global network map
- #Asia market analysis PPT
- #map graph slide
- #country data visualization PowerPoint
About the Product
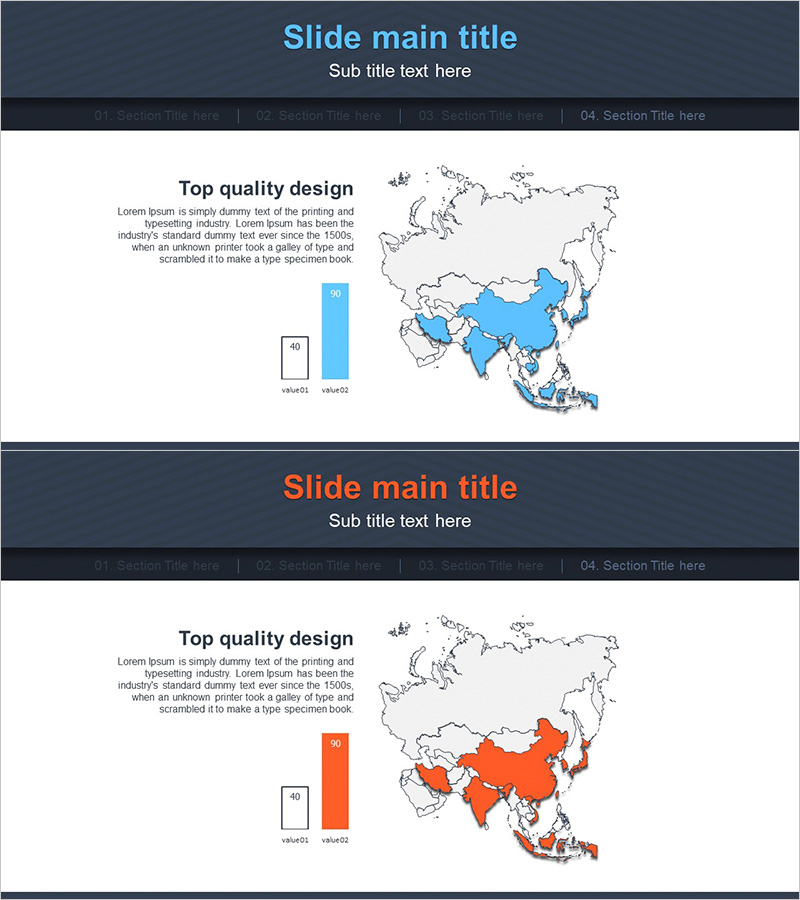
A world map PowerPoint slide designed to visualize global market analysis and target country status by region. This presentation template features two versions highlighting the Asia region—one in blue and one in orange—each combined with a bar graph to simultaneously convey geographic information and numerical data. The clear separation between the dark gray header area and white content area ensures excellent readability. Ideal for international business presentations, market entry strategies, regional performance analysis, and other scenarios requiring geographic and data visualization in professional slide decks.
Usage Points
-
Main Usage
Effectively communicate global market status and regional target countries in international business presentations by combining map visualization with bar graph data. Ideal for explaining market entry strategies, regional performance metrics, and global network expansion initiatives with geographic context and numerical insights.
-
How to Use
Slide 1 features a blue Asia map with bar graph; Slide 2 displays an orange Asia map with bar graph. Edit the map colors and graph data on each slide to input your actual target countries and numerical values, then use immediately in your presentation.
-
Recommended For
International marketing managers, overseas business development teams, global strategy planners, market research analysts, and investment relations professionals presenting regional market status, target country analysis, and global expansion plans.
-
Slide Structure
2-slide template. Each slide includes a dark gray header section (title, subtitle, navigation bar) and white content area with an Asia-highlighted world map (blue/orange version) and a 2-item comparison bar graph (value01, value02). 16:9 widescreen format, PPTX file.
Related Products
-

Global Country Analysis Vertical Bar Graph – Market and Competitor Analysis
#Company Introduction #Market and Competitor Analysis #Graph
-

Global Market Analysis Map – Importance of Market Connectivity
#Company Introduction #Market and Competitor Analysis #Graph
-

Business Plan Presentation Template - World Wide Map
#Market and Competitor Analysis #Financial Plans and Performance #Graph
-

Paint Splash Template for Visualizing Global Network
#Company Introduction #Market and Competitor Analysis #Other
