Financial Business Process Diagram – Efficient Workflow
RJ0300061_29
- Last Update 05/05/2025
- File Size 1.9MB
- # of Slides 2
- File Format PPTX
- Slide Ratio 16:9
- Color
Keywords
- #Content-Based Slides
- #Design-Based Slides
- #Business Strategy
- #Operational Plan
- #Diagram
- #Step-by-Step Schedule Plan
- #Business Processes
- #Flow
- #Cluster
- #Circular Flow
- #Chain Diagram
- #16:9
- #circular process diagram PowerPoint
- #4-step workflow slide
- #business process PowerPoint template
- #financial workflow diagram
- #how to create process flow in PowerPoint
About the Product
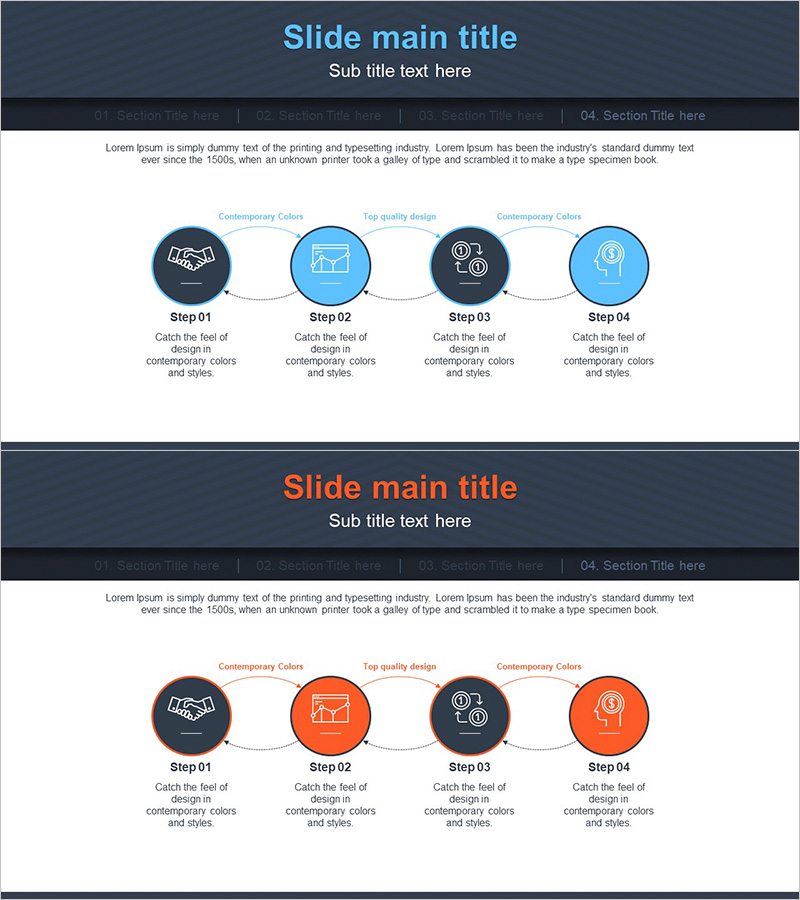
A 4-step circular process diagram PowerPoint slide designed to visualize financial and business workflow. The slide features a dark gray background with blue and orange dual-tone circular nodes connected by dotted lines, creating a clear cyclical structure. Each step includes an icon and descriptive text for intuitive communication of process flow, business cycles, and sequential progress. This presentation slide is ready for immediate editing and use in 16:9 widescreen format, PPTX file type, with 2 slides included.
Usage Points
-
Main Usage
Breaks down financial and business processes into 4 sequential steps with visual clarity. Helps audiences understand cyclical workflows, repetitive processes, and stage-by-stage progression through intuitive diagram design.
-
How to Use
Use this slide in company overview, business strategy, or operational planning presentations to explain core workflow steps. Simply edit the node text and icons to match your specific process requirements.
-
Recommended For
Ideal for financial analysts, consultants, IT professionals, project managers, and operations specialists presenting process improvements. Suitable for investor presentations, internal training sessions, and client proposals.
-
Slide Structure
2-slide set. Each slide features a dark gray header area with title and subtitle, and a main content area displaying 4 circular nodes connected by dotted lines in a circular arrangement. First slide uses blue tone; second slide uses orange tone for color variation.
Related Products
-

Business Process Diagram Slide Template – Business Strategy
#Business Strategy #Operational Plan #Diagram
-

Airplane Business Process Steps Slide – Visualized Business Strategy
#Business Strategy #Operational Plan #Diagram
-

Business Process Connection Diagram – Visualizing Business Strategy
#Business Strategy #Operational Plan #Diagram
-

Visualizing Daily Work Processes – Effective Operational Planning
#Business Strategy #Operational Plan #Diagram
