Competitor Analysis Broken Line Graph – Valuable Market Insights
RJ0300061_19
- Last Update 05/04/2025
- File Size 0.2MB
- # of Slides 2
- File Format PPTX
- Slide Ratio 16:9
- Color
Keywords
About the Product
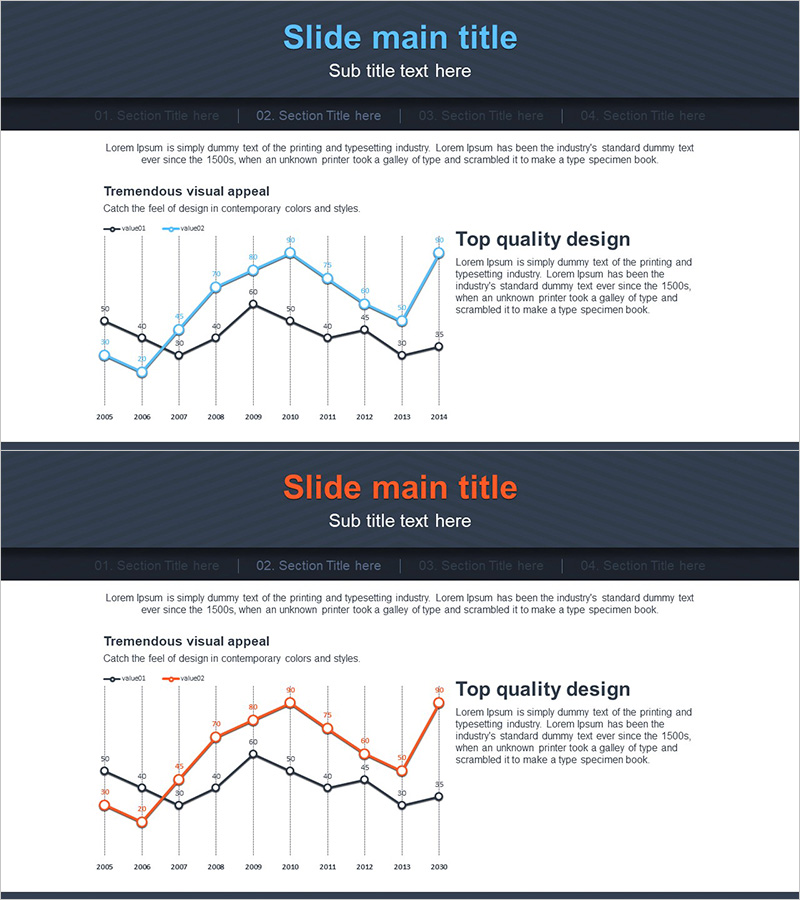
A dual-series line chart PowerPoint slide designed to compare competitor performance trends over time. This presentation template visualizes data from 2005 to 2014 using two distinct color series—blue and black—with circular markers at each data point for precise value identification. Vertical gridlines segment the timeline by year, and a text box on the right side provides space for key insights. Delivered in 16:9 widescreen PPTX format, this slide is fully editable and ready for immediate use in business presentations.
Usage Points
-
Main Usage
Visualize competitor performance trends and market dynamics using two overlapping line series. This chart effectively displays long-term data spanning a decade, enabling clear comparison of two competitors, products, or metrics simultaneously.
-
How to Use
Input actual competitor data into the PowerPoint slide to create market analysis presentations. Edit the numerical values directly in the chart, customize the text box with strategic insights, and use the slide in executive reports, strategy meetings, or investor presentations.
-
Recommended For
Ideal for executive briefings, strategic planning sessions, investor pitch decks, and market analysis presentations. Marketing teams, strategy departments, and sales teams can use this template to demonstrate competitive advantage and identify market opportunities in business plans and quarterly reports.
-
Slide Structure
Two-slide set with color variations: first slide emphasizes blue series, second slide highlights orange series. Each slide contains 10 data points (2005–2014), dual-series line chart, 9 vertical gridlines for year segmentation, and one editable text box for insights.
Related Products
-

Modern Theme Competitor Analysis Graph
#Market and Competitor Analysis #Graph #Competitor Analysis
-

Market Competitiveness Comparison Graph – Highlighting Competitive Advantage
#Market and Competitor Analysis #Graph #Competitor Analysis
-

Broken Line Comparison Graph – Optimized for Market and Competitor Analysis
#Market and Competitor Analysis #Graph #Competitor Analysis
-

Variation Graph for the Line Chart – Optimized Design for Market and Competitor Analysis
#Market and Competitor Analysis #Graph #Competitor Analysis
