Target Country Distribution Graph – Strategic Visualization for Market Analysis
RJ0300061_24
- Last Update 05/05/2025
- File Size 0.2MB
- # of Slides 2
- File Format PPTX
- Slide Ratio 16:9
- Color
Keywords
- #Content-Based Slides
- #Design-Based Slides
- #Market and Competitor Analysis
- #Marketing Plan and Strategy
- #Graph
- #Other
- #Target Market
- #Target Market Strategy
- #Other
- #Other Charts
- #Map
- #16:9
- #world map PowerPoint slide
- #target country distribution template
- #market analysis map
- #regional percentage chart
- #global marketing presentation
- #geographic data visualization
About the Product
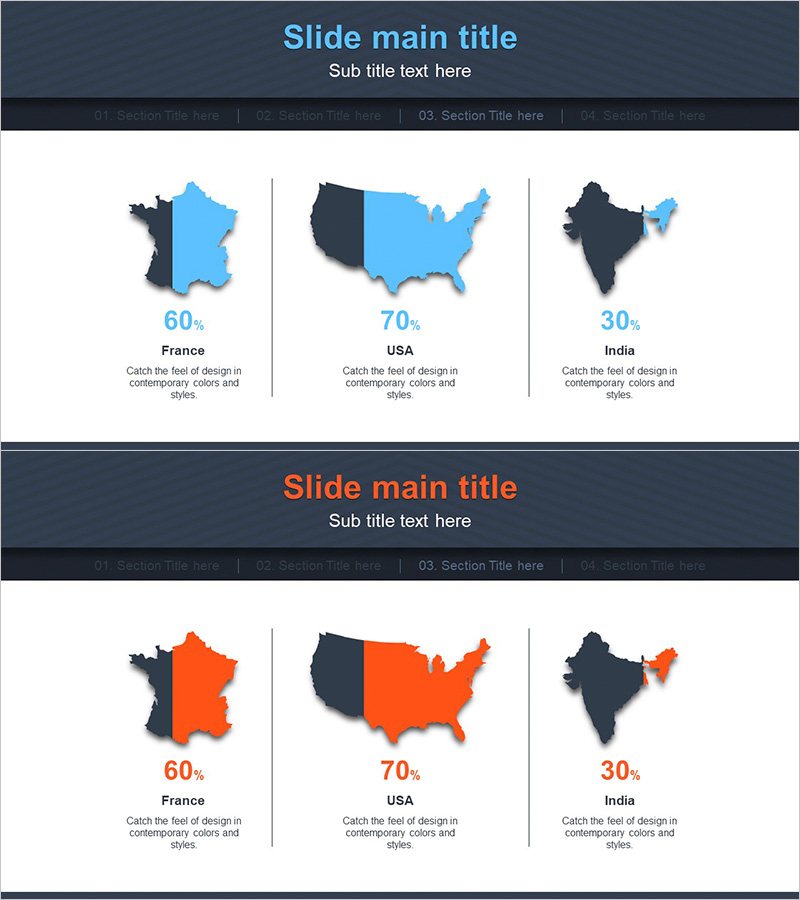
A world map-based PowerPoint slide for visualizing target country distribution in global market analysis. This presentation template displays market share across France, USA, and India using color-coded geographic regions on a dark navy background with light blue and orange accent colors. Each country includes percentage data (60%, 70%, 30%) and descriptive text, making it ideal for marketing strategy presentations, market entry plans, and sales reports. The 2-slide set offers color variations (blue and orange versions) and is optimized for 16:9 widescreen format, enabling clear regional performance communication in business presentations.
Usage Points
-
Main Usage
Visualize target country market share, performance, and global expansion status directly on a world map. Enables stakeholders to instantly understand regional data in marketing strategy presentations, market analysis reports, sales performance briefings, and investor pitch decks.
-
How to Use
Edit country names, percentages, and descriptive text on each slide with your own data. Use the blue version to emphasize trust and stability, or the orange version to highlight growth and activity. Duplicate map regions and text boxes to add additional countries as needed.
-
Recommended For
Ideal for marketing, sales, and strategy teams presenting market analysis, executive briefings, investor relations materials, international expansion plans, and regional sales performance meetings.
-
Slide Structure
Slide 1 (Blue): Dark navy background with light blue world maps (France, USA, India) + country-specific percentage figures + 3-line descriptive text per region. Slide 2 (Orange): Identical layout with orange-colored map regions. Total 2 slides, 16:9 aspect ratio, PPTX format.
Related Products
-

Target Market Share Map Graph – Market Analysis and Strategy
#Market and Competitor Analysis #Marketing Plan and Strategy #Graph
-

Dot Map Graph for Market Analysis Visualization – Strategic Approach
#Market and Competitor Analysis #Marketing Plan and Strategy #Graph
-

US Target Market Map for Marketing Analysis
#Market and Competitor Analysis #Marketing Plan and Strategy #Graph
-

European Target Country Analysis Graph – Strategic Market Insights
#Market and Competitor Analysis #Marketing Plan and Strategy #Graph
