Blue Orange Segmentation Graph – Market and Competitor Analysis
RJ0300061_10
- Last Update 05/04/2025
- File Size 0.2MB
- # of Slides 2
- File Format PPTX
- Slide Ratio 16:9
- Color
Keywords
- #Content-Based Slides
- #Design-Based Slides
- #Market and Competitor Analysis
- #Graph
- #Competitor Analysis
- #Market Analysis
- #Horizontal Bar
- #Segmented Horizontal Bar
- #16:9
- #segmentation graph PowerPoint
- #horizontal bar chart template
- #market analysis slide
- #competitor analysis PPT
- #data comparison chart download
About the Product
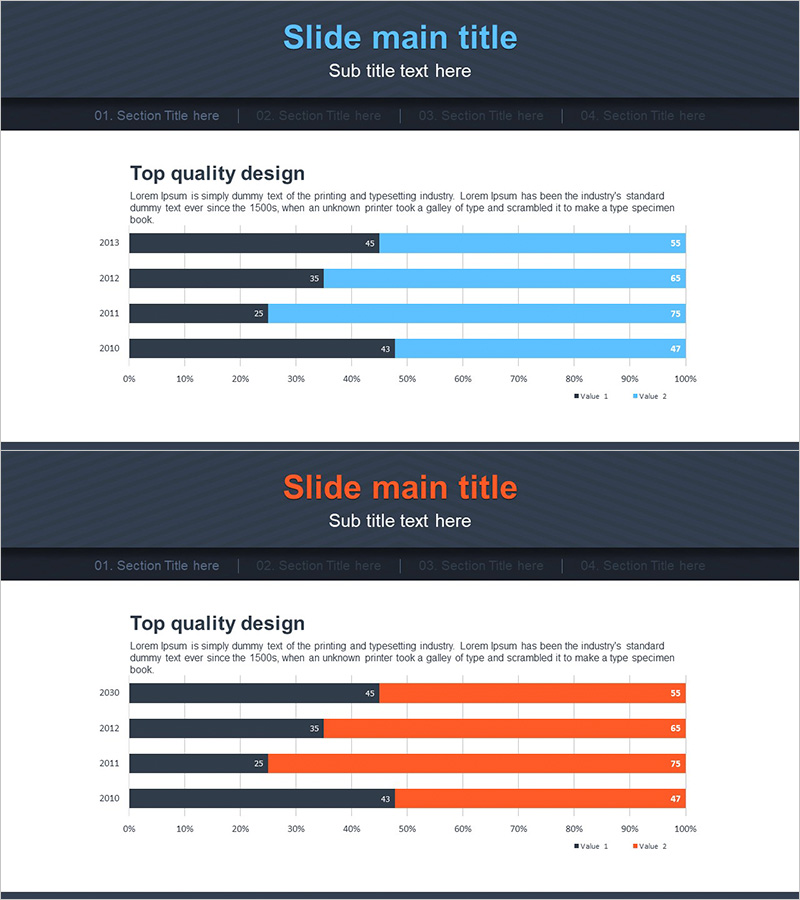
A segmentation graph PowerPoint slide optimized for market analysis and competitor analysis presentations. Featuring a dark navy background with blue and orange horizontal bars representing two data series, this slide visualizes year-over-year trends from 2010 to 2013 at a glance. Each year displays Value 1 and Value 2 in contrasting colors, making it ideal for presenting market share, revenue comparisons, customer satisfaction metrics, and other business indicators. Provided in 16:9 widescreen PPTX format, fully editable and ready to use in your presentation deck.
Usage Points
-
Main Usage
Designed to compare two data series across multiple years for market analysis, competitive positioning, revenue trends, and customer satisfaction metrics. Effectively communicates business growth, market share evolution, and competitive landscape to stakeholders.
-
How to Use
Replace Value 1 (dark navy) and Value 2 (blue/orange) with your actual data for each year. Adjust bar lengths and numerical values to reflect real-time data changes. Customize colors and legend as needed to match your brand or presentation theme.
-
Recommended For
Marketing managers, sales strategy teams, business analysts, management consultants, and executives presenting market insights and competitive analysis in board meetings, investor presentations, and strategic planning sessions.
-
Slide Structure
Two-slide layout with title area and horizontal bar graphs displaying four years (2010–2013) of data. Each year row contains two color-coded series (Value 1, Value 2) representing data points on a 0–100% scale for easy comparison.
Related Products
-

Chemical Experiment Analysis Horizontal Bar Graph
#Market and Competitor Analysis #Graph #Competitor Analysis
-

Body Organ Analysis Subdivision Graph - Market and Competitor Comparison
#Market and Competitor Analysis #Graph #Competitor Analysis
-

Horizontal Bar Graph Broken Down by Year – Optimal for Market and Competitor Analysis
#Market and Competitor Analysis #Graph #Competitor Analysis
-

Global Business Analysis Graph – Market and Competitor Analysis
#Market and Competitor Analysis #Graph #Competitor Analysis
