Business Connection Diagram – Cluster and History
RJ0300061_4
- Last Update 05/05/2025
- File Size 0.2MB
- # of Slides 2
- File Format PPTX
- Slide Ratio 16:9
- Color
Keywords
- #Content-Based Slides
- #Design-Based Slides
- #Company Introduction
- #Diagram
- #Company Overview
- #History
- #Cluster
- #Chain Diagram
- #16:9
- #vertical timeline diagram
- #business connection PowerPoint
- #4-stage process slide
- #diagram PowerPoint template
- #timeline PPT slide
- #company history presentation
- #business milestone slide
About the Product
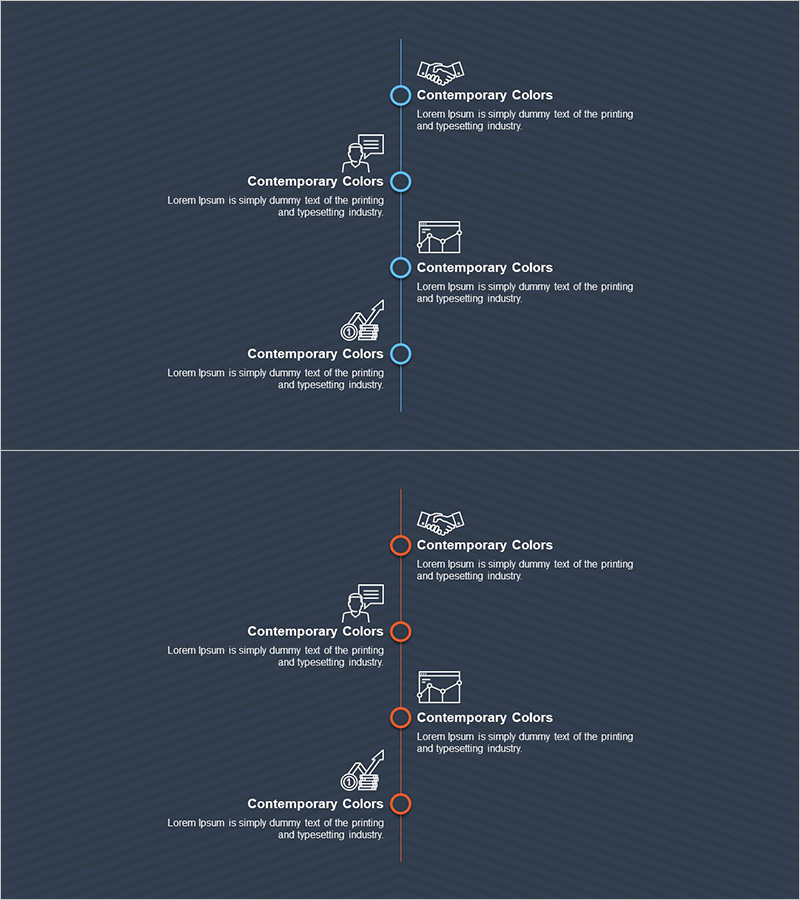
A vertical timeline diagram PowerPoint slide that visualizes business connections and temporal flow. Set against a dark slate background, cyan and orange circular nodes are arranged along a central vertical line, with icons and text areas at each stage. The 2-slide set features the first slide with 4 cyan nodes and the second with 4 orange nodes, enabling visualization of company history, organizational structure, business milestones, and partnerships in sequential stages. Available in 16:9 widescreen PPTX format for immediate editing and customization.
Usage Points
-
Main Usage
Ideal for visualizing corporate development history, organizational structure, business milestones, and partnership relationships in sequential stages. The vertical layout enables top-down or bottom-up information delivery, while node icons and text areas clearly communicate specific content at each stage.
-
How to Use
Use in company introduction presentations, organizational restructuring explanations, business history overviews, and strategic roadmap presentations. Customize node text and icons to match your content, and adjust colors to align with corporate branding. Combine both slides to represent additional stages or parallel processes.
-
Recommended For
Ideal for corporate executives, marketing teams, HR departments, and strategic planning teams presenting company introductions, organizational structures, business performance reports, and future plans. Particularly effective for presentations emphasizing phased changes or growth trajectories.
-
Slide Structure
2-slide set. Slide 1: Dark slate background with central vertical line, 4 cyan circular nodes alternating left-right placement, each node includes icon and text area. Slide 2: Identical layout with 4 orange nodes. 16:9 widescreen format, PPTX file type.
Related Products
-

Introduction to the History of the Architectural Company – A Visual Timeline
#Company Introduction #Diagram #Company Overview
-

Speech Concept: History Visualized – Effective Information Delivery
#Company Introduction #Diagram #History
-

Big Data Development Plan by Year Slide
#Company Introduction #Business Management #Diagram
-

Research and Development Overview Diagram – Innovation and Progress
#Company Introduction #Product/Service Introduction #Diagram
