Square Connection Circle Diagram – Visualizing Business Vision and Marketing Strategy
RJ0300061_18
- Last Update 05/04/2025
- File Size 0.2MB
- # of Slides 2
- File Format PPTX
- Slide Ratio 16:9
- Color
Keywords
- #Content-Based Slides
- #Design-Based Slides
- #Business Vision and Strategy
- #Marketing Plan and Strategy
- #Diagram
- #Business Goals
- #Marketing Objectives
- #Cluster
- #Chain Diagram
- #16:9
- #square connection circle diagram PowerPoint
- #cluster diagram slide template
- #bidirectional flow visualization
- #6-node diagram presentation
- #business vision strategy PPT
- #how to create connection diagram in PowerPoint
About the Product
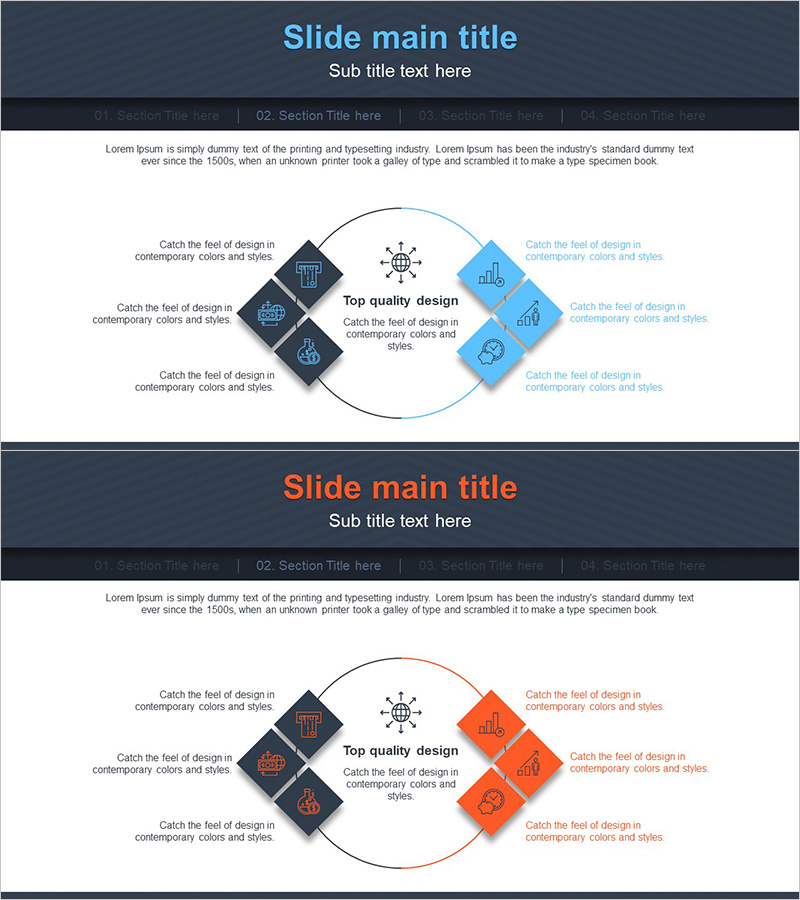
A cluster diagram PowerPoint slide featuring six square nodes arranged in a circular pattern to visualize bidirectional connection flows. The design uses a two-tone color scheme of dark navy and sky blue to distinguish contrasting left and right sections, with central icons and text emphasizing key messages. Each node includes icons and descriptive text, making it ideal for visualizing business vision, marketing strategy, organizational structure, and process flows. Available in 16:9 widescreen format as a 2-slide PPTX file, fully editable and ready for immediate use in presentations and planning documents.
Usage Points
-
Main Usage
Visually represents interconnected relationships, cyclical processes, and bidirectional strategic flows within organizations. Effectively communicates business vision and marketing strategy alignment, interdepartmental collaboration structures, and project feedback loops.
-
How to Use
Enter department names, strategy items, or process stages in each square node and add core messages in the center text. The contrasting navy and sky blue sections can represent two different perspectives or timeline phases. Customize icons to match your industry or organizational context.
-
Recommended For
Executive reports, strategic planning presentations, organizational restructuring explanations, marketing campaign briefs, business plans, and project management materials. Particularly effective in consulting, finance, IT, and manufacturing industries where complex relationships and flows require clear visualization.
-
Slide Structure
Two-slide set. First slide features sky blue-toned 6-node circular diagram; second slide uses dark navy and orange tones with identical structure. Both slides display symmetrical layout with center focal point, three nodes on left, three on right, connected by bidirectional arrows.
Related Products
-

Visualizing Global Marketing Goals Slide
#Business Vision and Strategy #Marketing Plan and Strategy #Diagram
-

Setting Business Core Goals – Foundation for Business Growth
#Business Vision and Strategy #Marketing Plan and Strategy #Diagram
-

Car Sharing Global Marketing Goals - Connecting Business Strategies
#Business Vision and Strategy #Marketing Plan and Strategy #Diagram
-

Business Goals 3D Footprint Diagram – Vision and Success
#Business Vision and Strategy #Marketing Plan and Strategy #Diagram
