Financial Business Area Slide – Diverging Diagram
RJ0300061_27
- Last Update 05/05/2025
- File Size 0.2MB
- # of Slides 2
- File Format PPTX
- Slide Ratio 16:9
- Color
Keywords
- #Content-Based Slides
- #Design-Based Slides
- #Company Introduction
- #Business Introduction
- #Diagram
- #Business Areas
- #Business Areas
- #Spread
- #16:9
- #business area diverging diagram PowerPoint
- #4-quadrant comparison slide
- #financial business PPT template
- #business portfolio presentation slide
- #how to create a diverging diagram in PowerPoint
About the Product
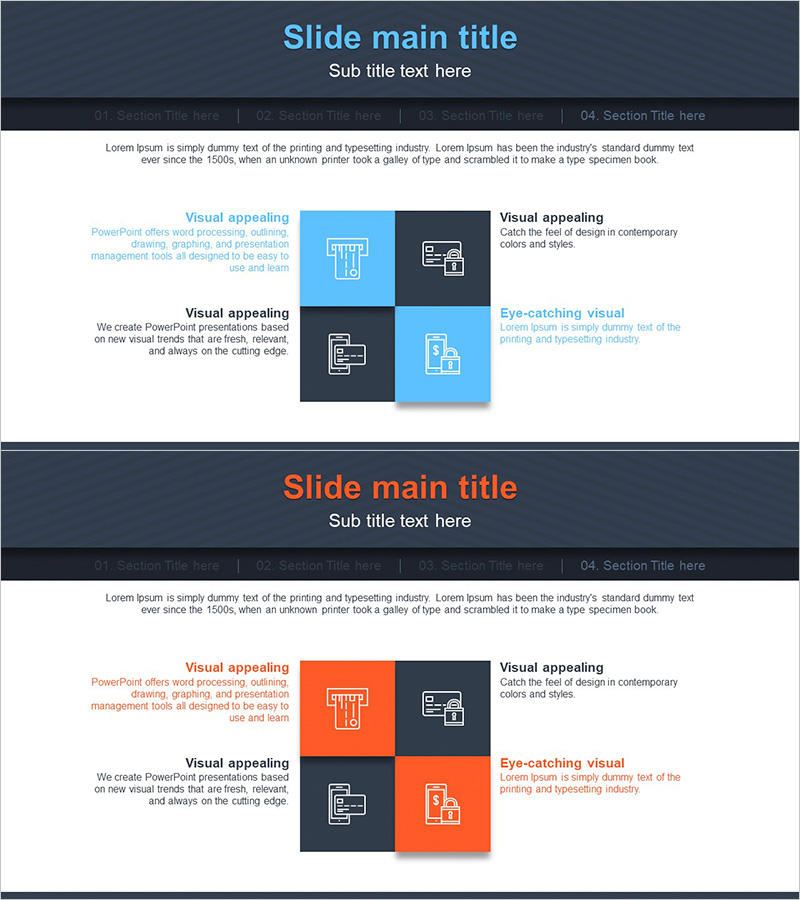
A PowerPoint slide that visualizes financial business areas using a 4-quadrant diverging diagram structure. The design features a blue and orange dual-tone color scheme with symmetrical left-right layout, allowing space for icons and text descriptions in each quadrant. Delivered as a 2-slide set with title and content slides, optimized for 16:9 widescreen format. Ideal for investor presentations, business briefings, and strategic meetings where complex business portfolios need to be communicated intuitively to stakeholders.
Usage Points
-
Main Usage
Categorizes and compares multiple business divisions of financial institutions using a 4-quadrant diverging structure. The symmetrical diagram layout visually expresses conflicting business characteristics or complementary relationships, providing clear decision-making support.
-
How to Use
Start with the title slide to introduce the topic, then populate the four quadrants on the content slide with business unit names and descriptions. Add icons or symbols representing each business division's characteristics to enhance visual differentiation and clarity.
-
Recommended For
Recommended for IR materials, business briefings, and executive reports from banks, insurance companies, securities firms, and financial institutions. Particularly effective when emphasizing portfolio diversity or explaining relationships between business units.
-
Slide Structure
2-slide set: title slide (with title, subtitle, and navigation bar) + content slide (4-quadrant diverging diagram with 1 icon per quadrant, 2-3 lines of descriptive text, symmetrical left-right layout). 16:9 ratio, PPTX format with fully editable elements.
Related Products
-

Diffusion Graph without Business Focus – Flexible Business Presentation
#Company Introduction #Business Introduction #Diagram
-

Financial Management Services Area Diagram – Visualizing Business Areas
#Company Introduction #Business Introduction #Diagram
-

Financial Services Solutions Diagram – Highlighting Business Core and Values
#Company Introduction #Business Introduction #Diagram
-

Solution Area Diagram – Ideal for Business Area Analysis
#Company Introduction #Business Introduction #Diagram
