Competitor Analysis Bar Graph - Visualizing Market Status
RJ0300061_7
- Last Update 05/05/2025
- File Size 0.2MB
- # of Slides 2
- File Format PPTX
- Slide Ratio 16:9
- Color
Keywords
- #Content-Based Slides
- #Design-Based Slides
- #Market and Competitor Analysis
- #Graph
- #Competitor Analysis
- #Competitive Advantage
- #Column
- #Column Chart
- #16:9
- #competitor analysis chart
- #horizontal bar graph PowerPoint
- #market status presentation
- #comparison chart slide
- #competitive analysis template download
About the Product
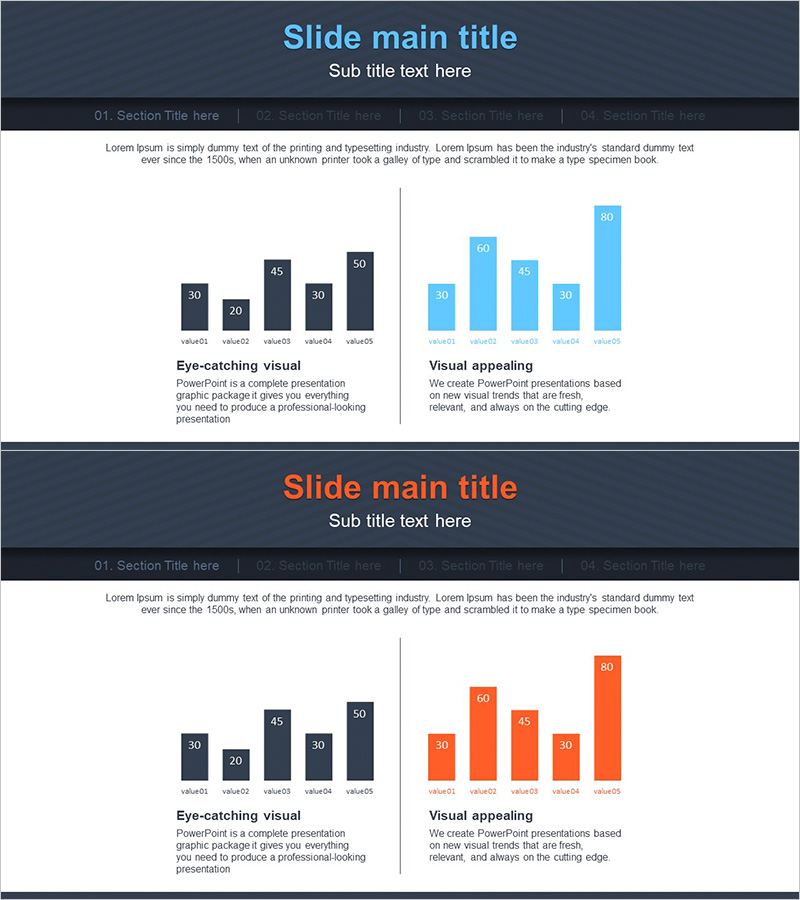
A horizontal bar chart PowerPoint slide designed to visualize competitor analysis and market status. This presentation template features two color series—dark navy and sky blue—displaying five comparable data items with clear numerical values. Provided in 16:9 widescreen format across 2 slides, it's ready for immediate use in competitive benchmarking, market share analysis, product performance comparison, and strategic presentations. The bar heights and color differentiation make data differences immediately apparent to your audience.
Usage Points
-
Main Usage
Communicate quantitative competitive data through bar height representation, enabling audiences to instantly grasp numerical differences. The dark navy and sky blue color contrast clearly distinguishes between two data series, making comparative analysis intuitive and professional.
-
How to Use
Deploy in business strategy presentations, investor briefings, marketing planning meetings, and quarterly performance reports when analyzing competitive environments. Adjust bar heights to input actual data, modify axis labels and legends to match your presentation context, and customize colors as needed.
-
Recommended For
Strategy planners, marketing professionals, sales managers, executive report coordinators, and consulting analysts who need to communicate competitive findings clearly. Ideal for B2B presentations and reports requiring quantitative comparisons and data-driven insights.
-
Slide Structure
Two-slide template with horizontal bar charts on each slide. The first slide displays dark navy bars representing one data series, while the second slide shows sky blue bars for a second series, enabling side-by-side comparison. Numerical labels appear above each bar for precise value reference and professional presentation.
Related Products
-

Online Presentation Template Comparison Chart – Visualizing Competitive Analysis
#Market and Competitor Analysis #Graph #Competitor Analysis
-

Color Highlight Vertical Bar Graph – Market Competition Analysis
#Market and Competitor Analysis #Graph #Competitor Analysis
-

Competitor Analysis Bar Graph – Visualizing Market Competitive Advantages
#Market and Competitor Analysis #Graph #Competitor Analysis
-

Competitor Analysis Bar Graph – Enhancing Market Insights
#Market and Competitor Analysis #Graph #Competitor Analysis
