Market Share Analysis Area & Pie Chart – The Power of Data Visualization
RJ0300061_16
- Last Update 05/04/2025
- File Size 0.9MB
- # of Slides 2
- File Format PPTX
- Slide Ratio 16:9
- Color
Keywords
- #Content-Based Slides
- #Design-Based Slides
- #Product/Service Introduction
- #Market and Competitor Analysis
- #Graph
- #Development Status
- #Market Analysis
- #Circles
- #Other
- #Pie Chart
- #Radar Chart Spider Chart
- #16:9
- #radial chart PowerPoint
- #pie chart slide template
- #data visualization presentation
- #market share analysis PPT
- #comparison chart download
About the Product
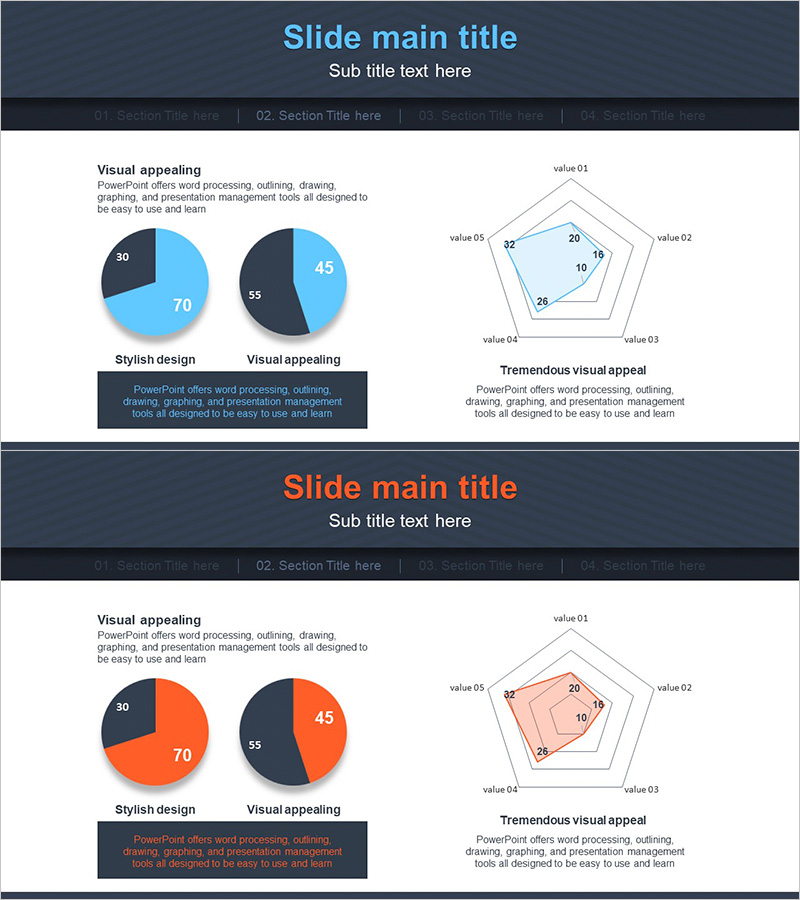
A 2-slide set optimized for market share analysis, competitive benchmarking, and performance metrics comparison. Combines two pie charts (70:30 and 55:45 ratios) with a 5-value radial (radar) chart for multi-dimensional data visualization. Light blue, dark navy, and orange color palette reinforces business credibility. PowerPoint slides are fully editable—input your actual data and the charts update automatically. Ideal for executive presentations, investor pitches, and strategic reviews.
Usage Points
-
Main Usage
Transforms quantitative data into intuitive visuals that enhance audience comprehension. Pie charts clarify part-to-whole ratios, while the radial chart enables side-by-side comparison of multiple indicators (price, quality, customer satisfaction, innovation, market share). Essential for business analysis, competitive positioning, and performance reviews.
-
How to Use
Slide 1 introduces market composition using two pie charts. Slide 2 compares detailed metrics via the 5-value radial chart. Double-click chart values to input your data—visualization updates automatically. Customize colors and labels to match your brand guidelines.
-
Recommended For
Executive reports, investor relations presentations, marketing strategy sessions, and business performance analysis. Ideal for finance teams, marketing departments, business planning units, and consulting firms presenting quantitative evidence.
-
Slide Structure
Slide 1: Two pie charts (70:30 and 55:45 ratios) with text description area. Slide 2: 5-value radial chart (value 01–05) with legend and text section. Light blue background with dark navy and orange accents. 16:9 widescreen format, PPTX file.
Related Products
-

Online Presentation Template - Pie Chart & Radar Chart
#Product/Service Introduction #Market and Competitor Analysis #Graph
-

Pie Chart Slide for Status of Service Technology Development
#Product/Service Introduction #Market and Competitor Analysis #Graph
-

Current Status Analysis Pie Chart – Insights for Market Analysis
#Product/Service Introduction #Market and Competitor Analysis #Diagram
-

Medical Analysis Pie Chart – Visualization of Market Trends
#Product/Service Introduction #Market and Competitor Analysis #Graph
