Global User Status Analysis Graph – Data Visualization
RJ0300061_11
- Last Update 05/04/2025
- File Size 0.6MB
- # of Slides 2
- File Format PPTX
- Slide Ratio 16:9
- Color
Keywords
- #Content-Based Slides
- #Design-Based Slides
- #Market and Competitor Analysis
- #Graph
- #Other
- #Customer Analysis
- #Target Market
- #Other
- #Other Charts
- #Map
- #16:9
- #world map PowerPoint slide
- #global data visualization
- #regional analysis presentation
- #country statistics slide
- #market research template
- #geographic data PPT
About the Product
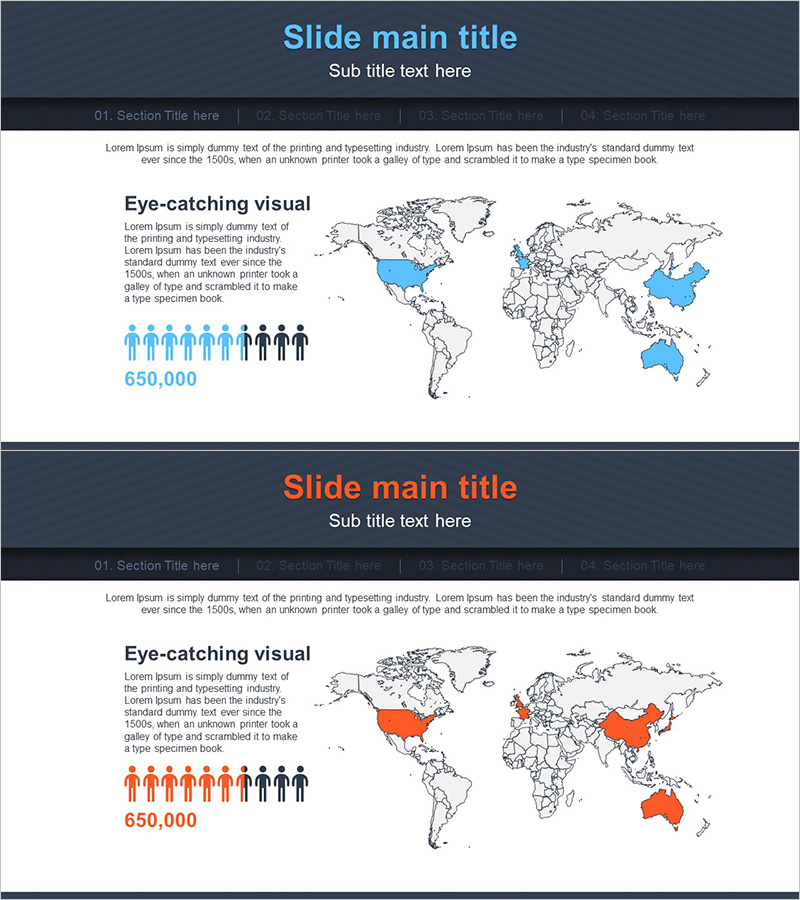
A professional world map-based PowerPoint slide set designed to present global market analysis and country-specific user distribution at a glance. The dark background minimalist map features blue and orange regional highlights that create strong visual contrast and emphasis. Population statistics icons and numerical data are strategically positioned to support global customer analysis, market research, and target region strategy presentations. The 2-slide composition uses color variations to demonstrate multiple comparison scenarios, while the 16:9 widescreen format ensures compatibility with all presentation environments and immediate usability for international business pitches.
Usage Points
-
Main Usage
Communicate global market size, country-specific customer distribution, and regional business performance through map-based visualization. Color-coded geographic emphasis combined with population icons clarifies the geographic context of numerical data, enhancing credibility in international business presentations.
-
How to Use
Insert into investor pitch decks, market expansion strategy presentations, or global customer analysis reports in the 'Market Overview' or 'Target Regions' section. Replace map highlights and statistics with your own data for immediate deployment. Use the color-variant slide to present comparative analysis scenarios across different regions or time periods.
-
Recommended For
Global business managers, marketing strategy teams, international market research specialists, and business development executives presenting regional performance analysis and expansion strategies. Particularly valuable for multinational corporations delivering quarterly performance reports and new market entry presentations to stakeholders.
-
Slide Structure
Slide 1: Dark background world map with three blue-highlighted regions (North America, China, Australia), left-aligned population icons (10 figures) and '650,000' metric. Slide 2: Identical layout with three orange-highlighted regions for comparative scenario analysis. 16:9 widescreen format with dedicated text areas for customization.
Related Products
-

Premium Management Presentation Map Analysis3 - Customer Insights and Market Analysis
#Market and Competitor Analysis #Graph #Other
-

Data Visualization Slide Template Featuring World Map
#Market and Competitor Analysis #Graph #Other
-

User Usage Status by Target Country – Market Analysis and Insights
#Market and Competitor Analysis #Diagram #Other
-

Map-Based Data Presentation Slide – Global Market Analysis
#Market and Competitor Analysis #Other #Customer Analysis
