Science Experiment Presentation Template – Clean and Professional Design
J0700019
- Last Update 01/31/2025
- File Size 17.2MB
- # of Slides 30
- File Format PPTX
- Slide Ratio 16:9
- Color
Slide Preview


Keywords
About the Product
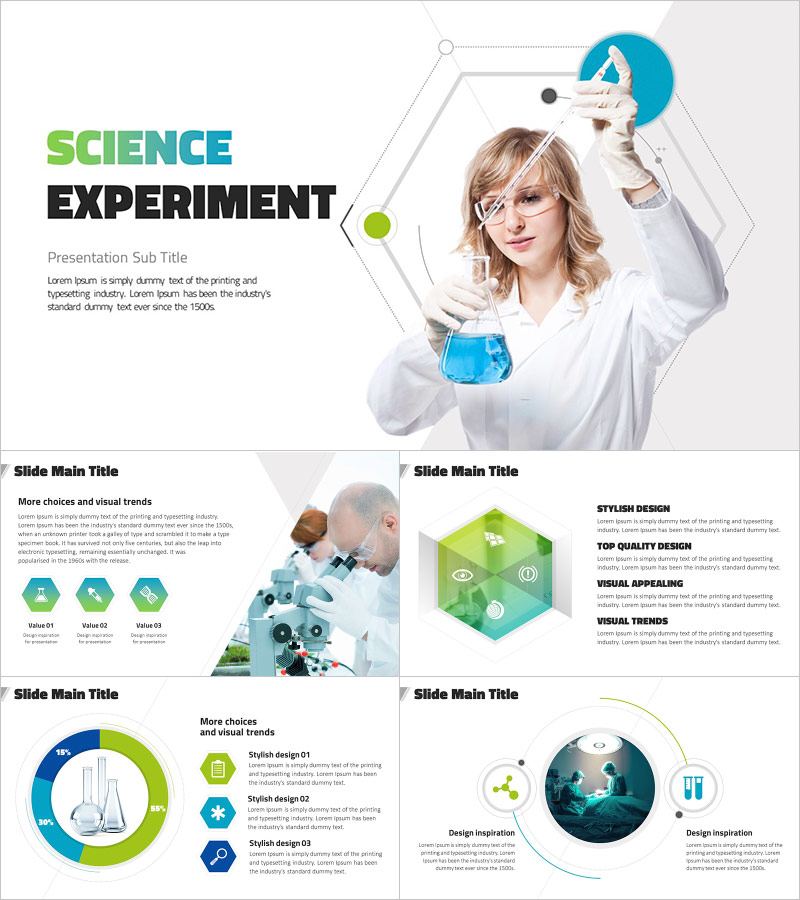
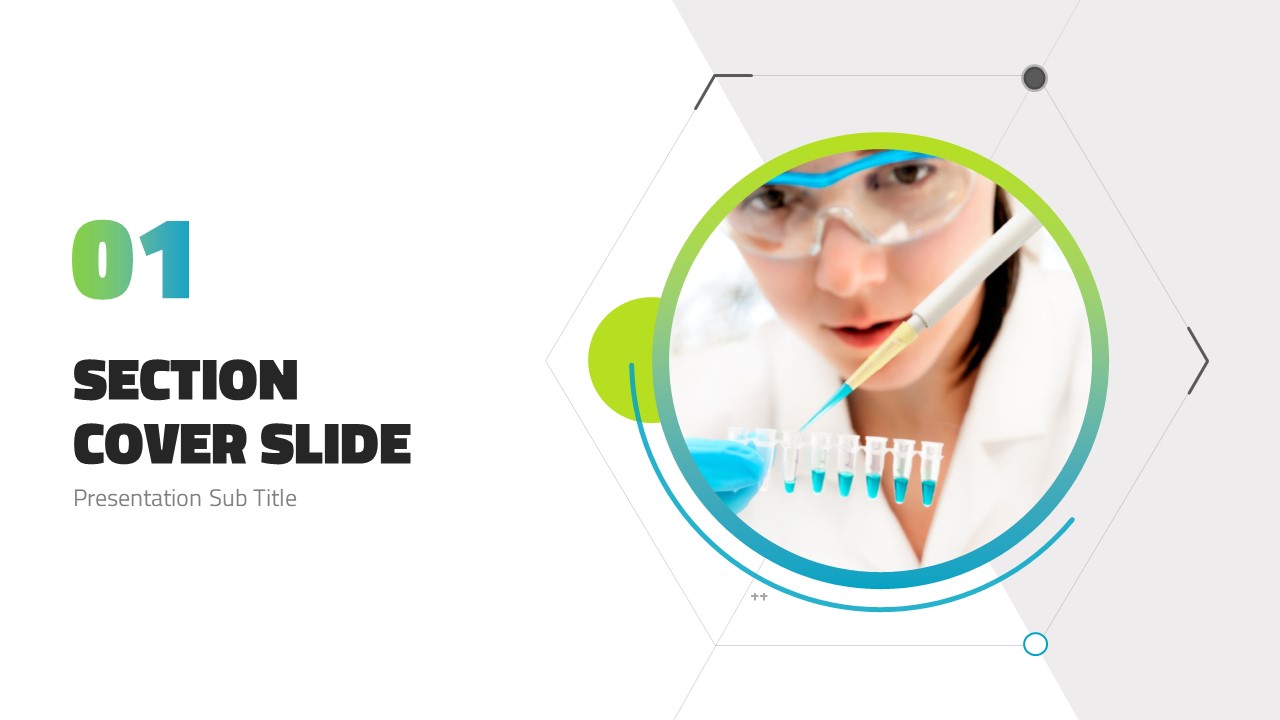
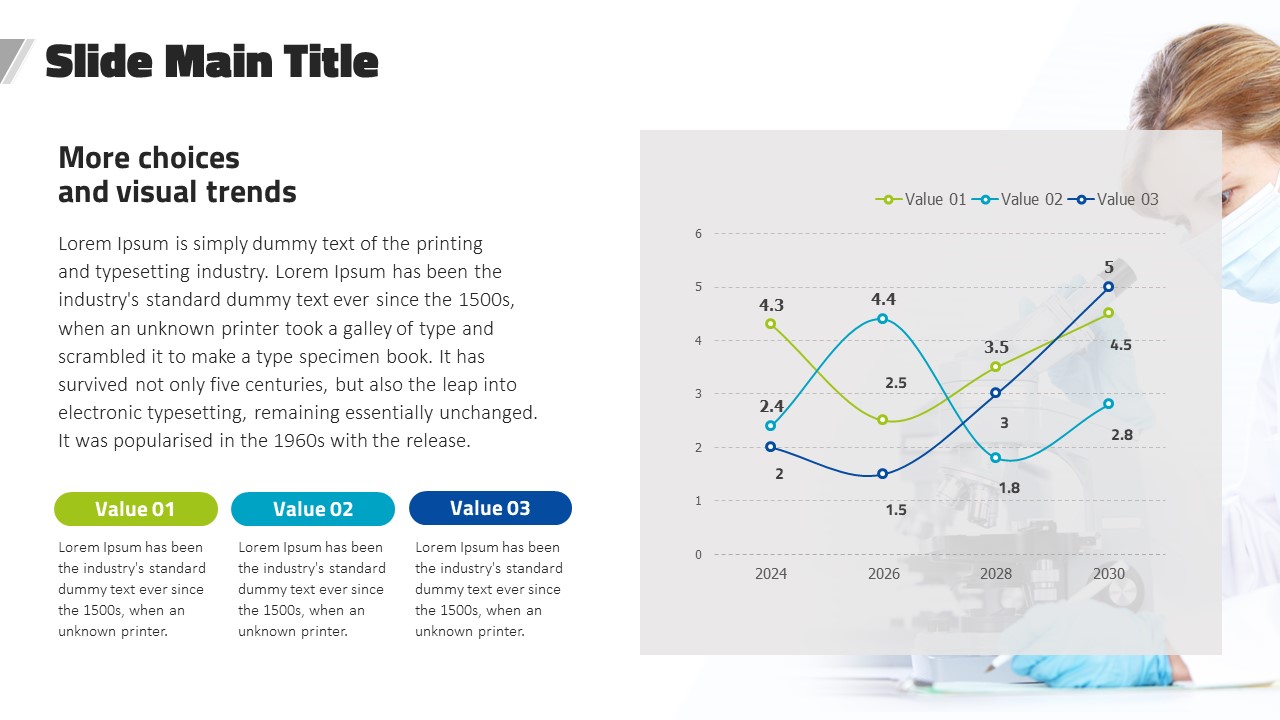
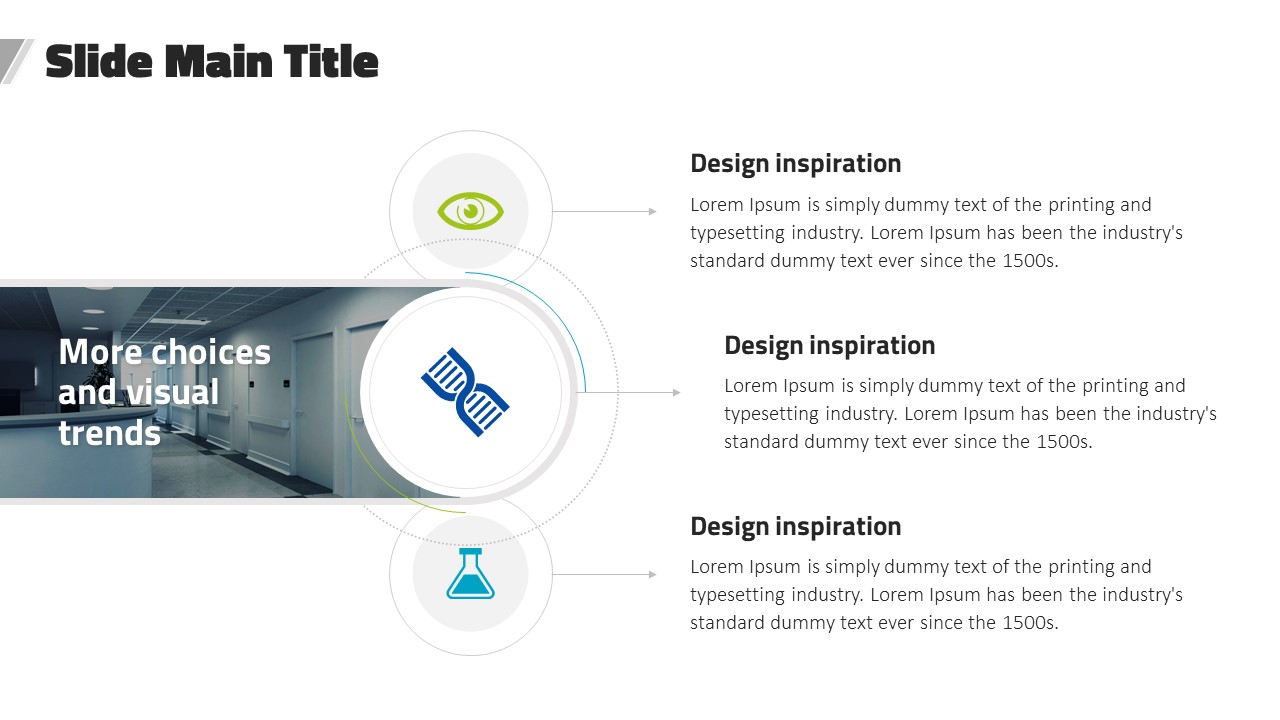
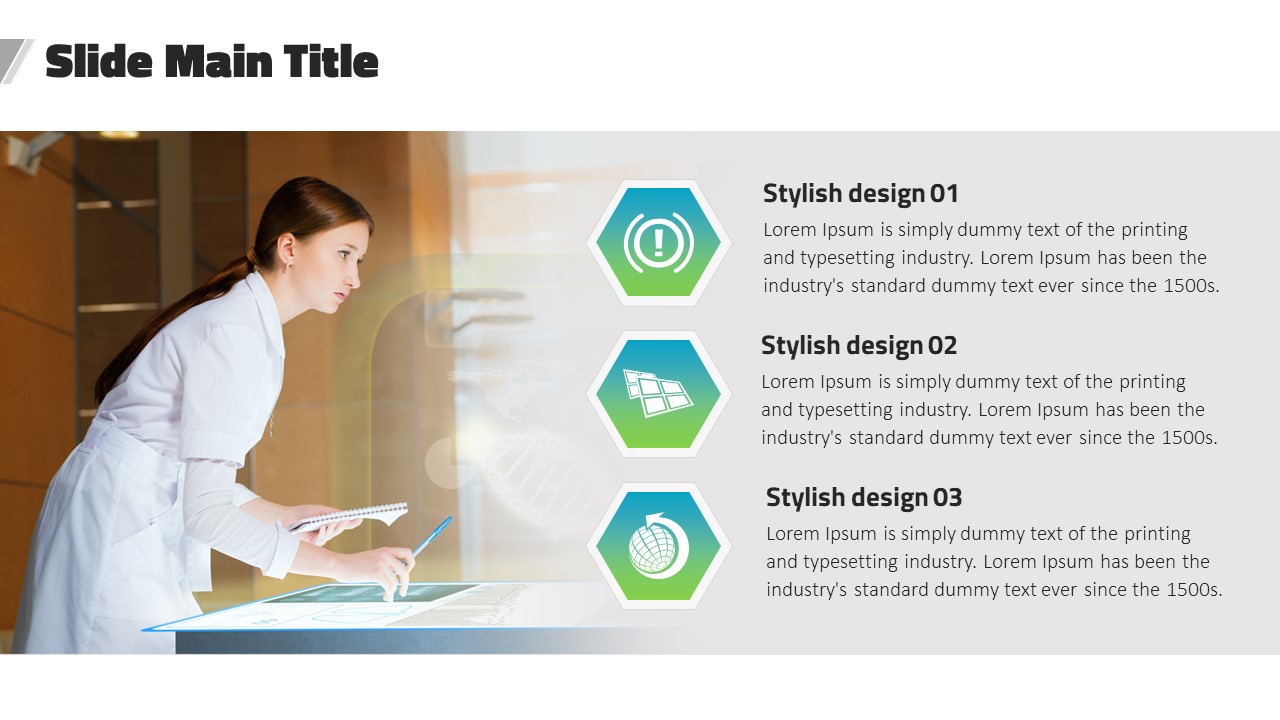
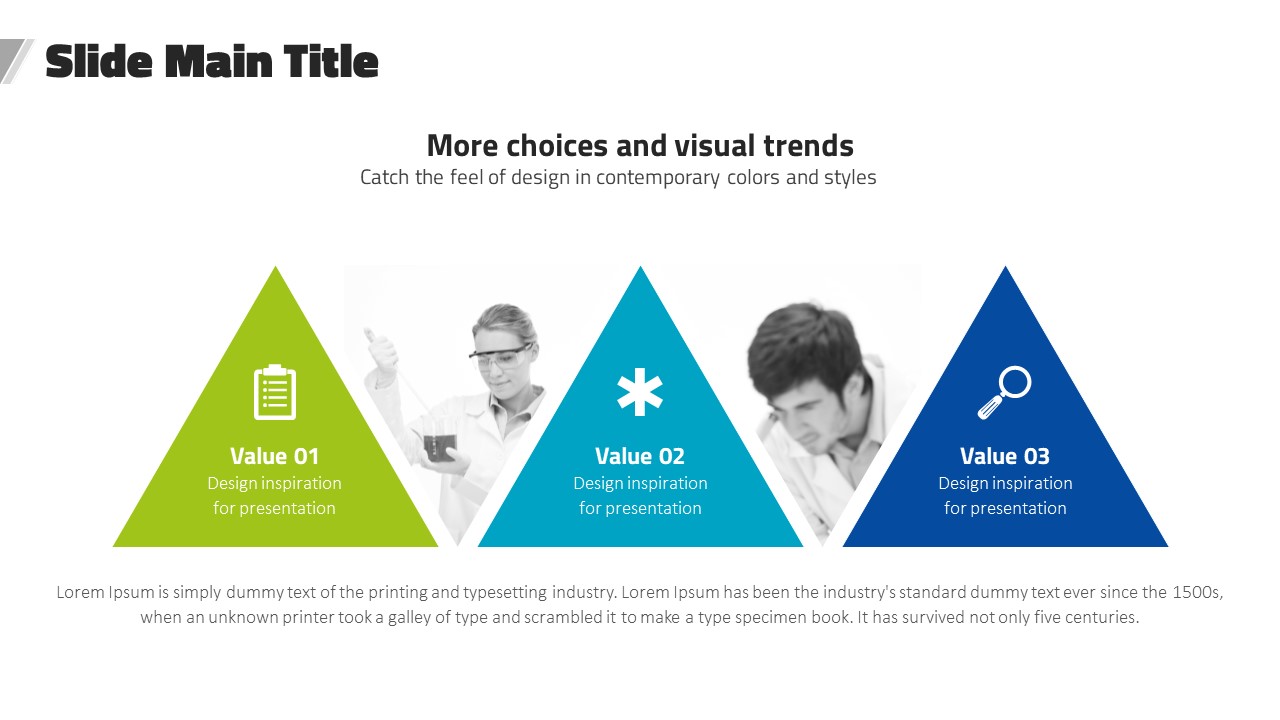
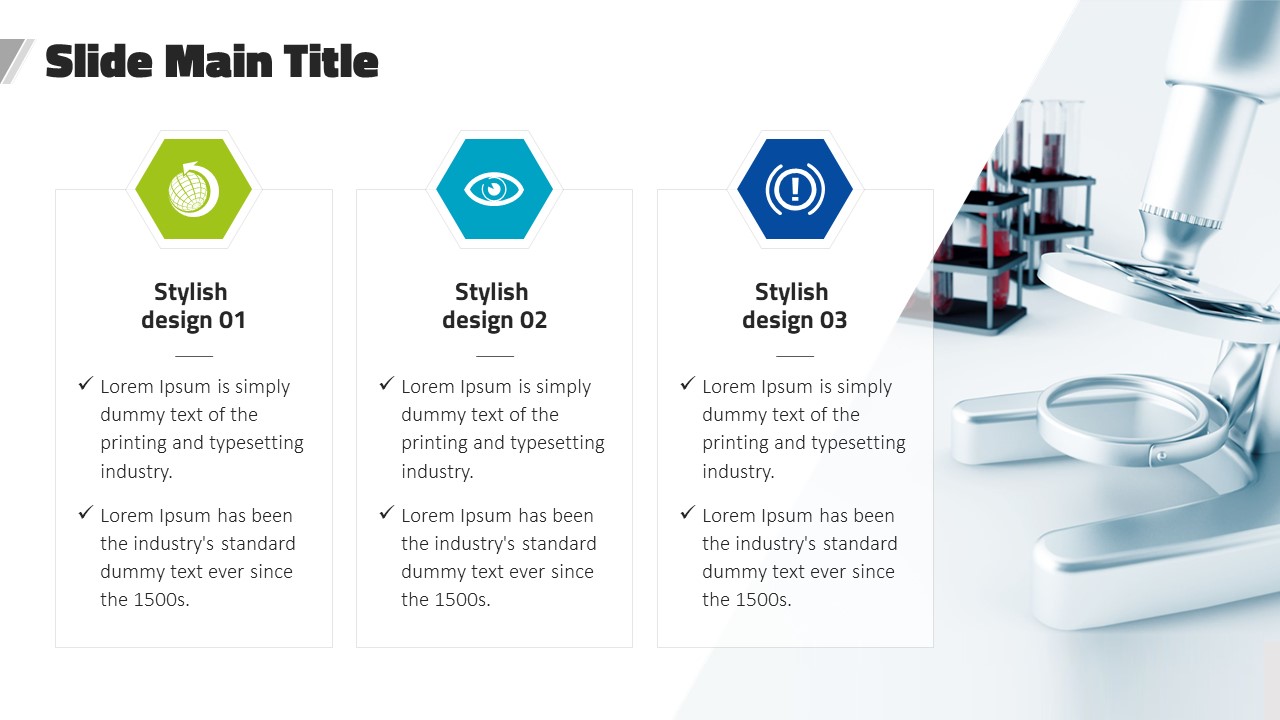
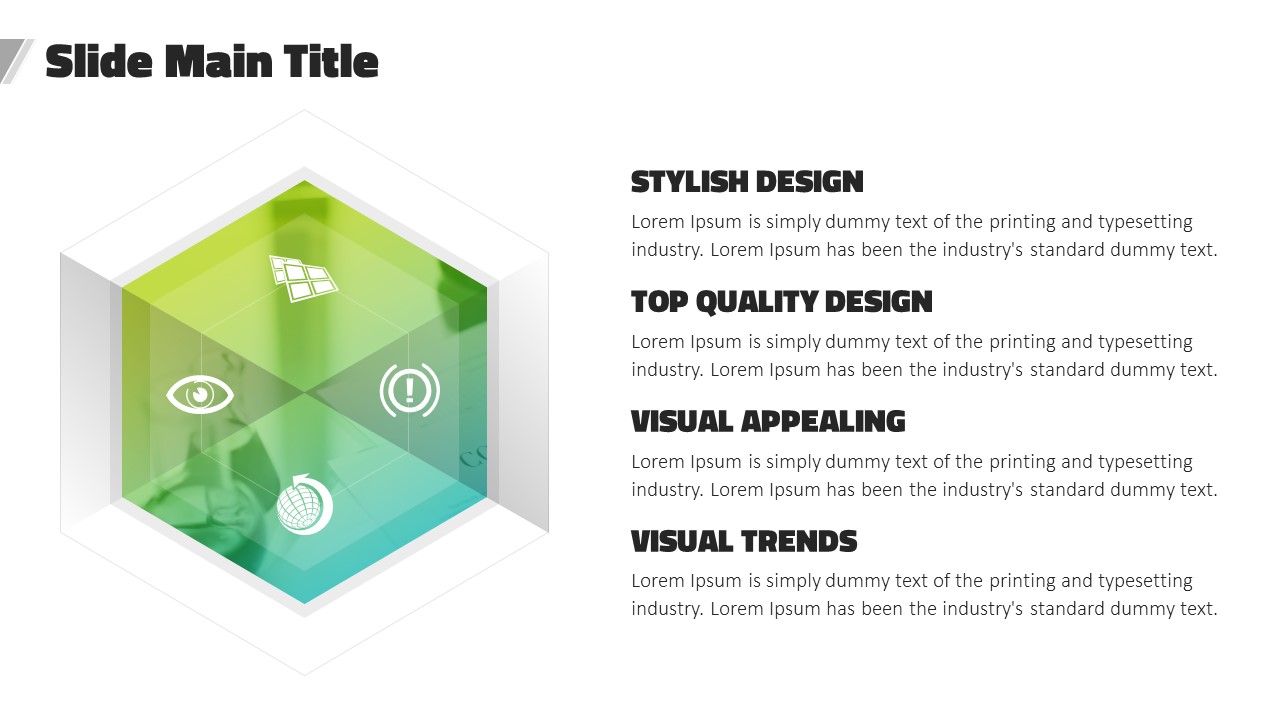
A professional PowerPoint template designed for science, research, and medical fields, featuring a clean white background with lime green and teal accent colors built around a repeating hexagon motif. The hexagonal graphic elements reinforce the precision and credibility associated with laboratory and academic research environments. This 30-slide presentation set includes a wide variety of layouts: a full-bleed cover slide with a lab researcher photo, three-column icon-and-value slides, hexagon infographic panels, donut chart slides, two-column image cards, and numbered list slides — giving you everything needed to structure a compelling research presentation from introduction to conclusion. The balanced two-column grid layout pairs real laboratory photography with solid-style icons, making complex scientific data easy to follow. Delivered in fully editable PPTX format at 16:9 ratio, this slide deck is ready to use for conference presentations, academic seminars, pharmaceutical reports, and healthcare product introductions.
Usage Points
-
Main Usage
Designed for presenting scientific research findings, experimental results, and academic studies in a clear and professional format. The hexagon motif and green-teal color scheme visually reinforce the precision and trustworthiness expected in science and medical presentations.
-
How to Use
Download the PPTX file and open it in PowerPoint or a compatible application. Replace the placeholder text, images, and data values with your own research content. Work through the slides in sequence — from the cover and introduction through data slides and conclusion — to build a polished presentation efficiently.
-
Recommended For
Graduate students and researchers preparing academic conference presentations, pharmaceutical and biotech companies reporting research outcomes, science educators creating lecture materials, and healthcare or medical device companies introducing products through professional slide decks.
-
Slide Structure
30 slides total, including a lab researcher photo cover, three-column icon-and-value slides, hexagon infographic panels with text lists, donut chart slides with step-by-step descriptions, two-column image cards featuring space and microscope photography, and left-photo plus numbered three-point list slides.
Related Products
-

Oriental Medicine Presentation Wide – Modern and Stylish Design
#Science/Medical
-

Science Experiment Presentation Template – Creative Visual and Design
#Science/Medical
-

Virus PowerPoint Template – Modern and Professional Design
#Science/Medical
-

Cell PPT Wide Template – Refreshing and Scientific Design
#Science/Medical
