Introduction to Science Experiments Diagram – Creative and Educational Visual Material
RJ0700019_16
- Last Update 07/27/2025
- File Size 1.2MB
- # of Slides 2
- File Format PPTX
- Slide Ratio 16:9
- Color
Keywords
- #Content-Based Slides
- #Design-Based Slides
- #Product/Service Introduction
- #Diagram
- #Product/Service Introduction
- #Cluster
- #Closed Cluster Diagram
- #16:9
- #closed-form cluster diagram PowerPoint
- #hexagon diagram slide template
- #science experiment presentation
- #relationship diagram PPT
- #educational diagram download
- #how to create cluster diagram in PowerPoint
About the Product
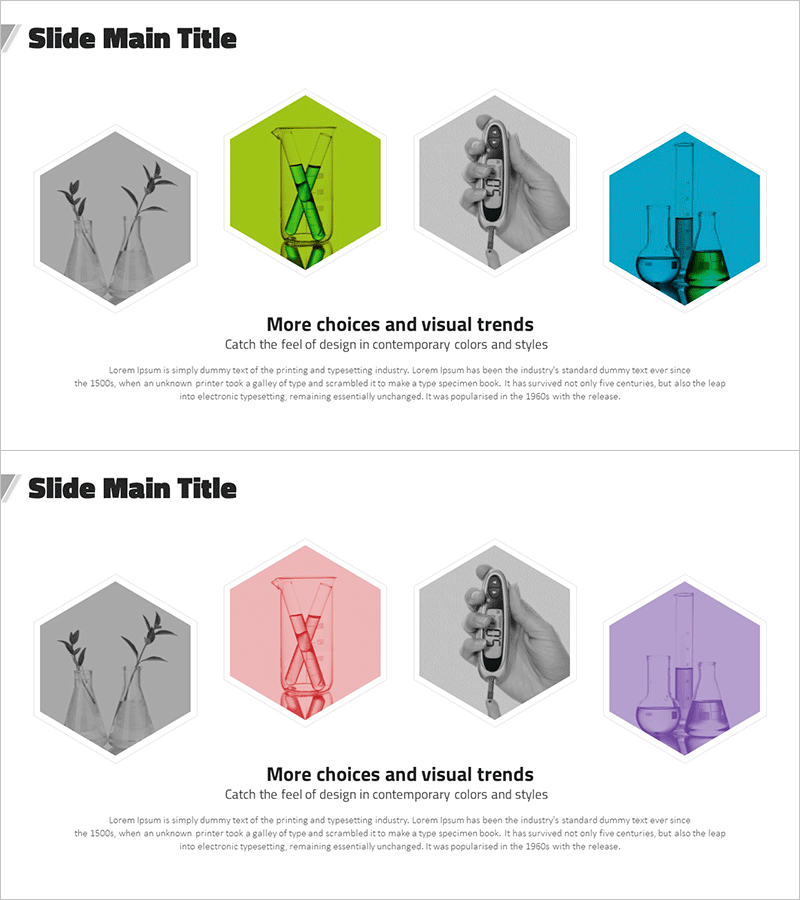
A closed-form cluster diagram PowerPoint slide optimized for science experiment and product introduction presentations. Four hexagonal nodes are arranged around a central concept, intuitively expressing the interrelationships between related elements. The design uses a vibrant color palette—lime green, gray, cyan, and purple—to visually distinguish each item, while incorporating black-and-white photography and line drawings to enhance educational credibility. Composed of 2 slides in 16:9 widescreen format, this fully editable PPTX template is ideal for science education materials, product feature overviews, process analysis, and various presentation scenarios.
Usage Points
-
Main Usage
Visualizes key elements of science experiments or core product features across four categorized items, showing their relationship to a central concept. The closed-form structure emphasizes both the independence and interconnectedness of each element, enhancing learner comprehension in educational contexts.
-
How to Use
Enter the core concept (e.g., science experiment name, product title) in the central title area, then populate the four hexagons with corresponding details (materials, methods, results, applications, etc.). Customize colors and icons to match each item's characteristics, and add animations as needed for presentation flow.
-
Recommended For
Science educators and instructors, educational institution managers, product marketing teams, research presenters, corporate training specialists. Suitable for K-12 science classes, university seminars, corporate onboarding programs, and product launch presentations.
-
Slide Structure
2-slide composition. Each slide features a central title area surrounded by 4 hexagonal nodes. Within each node, black-and-white photography or line drawings are paired with text input areas. Nodes are color-coded with lime green, gray, cyan, and purple backgrounds for visual distinction, optimized for 16:9 widescreen display.
Related Products
-

Learning Tool Description – Creative Design Clusters
#Product/Service Introduction #Diagram #Product/Service Introduction
-

Product Introduction Template Featuring Korean Traditional Masks
#Product/Service Introduction #Diagram #Product/Service Introduction
-

Business Program Introduction Diagram – Visualization and Efficiency
#Product/Service Introduction #Diagram #Product/Service Introduction
-

Introduction to Car Maintenance Service Types
#Company Introduction #Product/Service Introduction #Diagram
