Step-by-step Science Experiment Program Slide Template – Emphasizing Educational Value
RJ0700019_5
- Last Update 07/27/2025
- File Size 1.3MB
- # of Slides 2
- File Format PPTX
- Slide Ratio 16:9
- Color
Keywords
- #Content-Based Slides
- #Design-Based Slides
- #Product/Service Introduction
- #Business Strategy
- #Diagram
- #Program Introduction
- #Step-by-Step Schedule Plan
- #Cluster
- #Closed Cluster Diagram
- #16:9
- #hexagon diagram PowerPoint
- #cluster diagram slide template
- #science education presentation
- #6-node diagram
- #educational program PPT slide
- #PowerPoint diagram template
- #radial cluster slide
About the Product
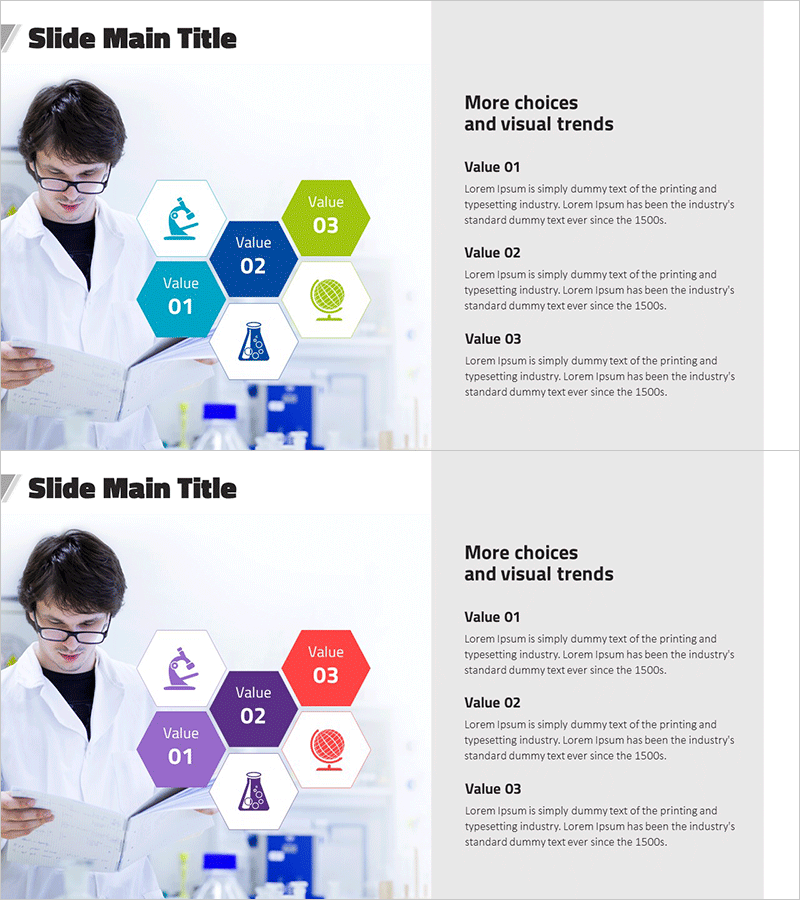
A PowerPoint slide that visualizes the core values of science experiment programs using a hexagon cluster structure. Six hexagon nodes in three color tones—cyan, blue, and green—are arranged radially around a central hub, with science icons (microscope, beaker, sphere, flask) embedded in each node. The 2-slide set offers two color variations (cyan-blue-green and purple-blue-red), allowing you to match your presentation theme and brand colors. Ideal for educational institutions, science centers, and corporate training programs to highlight multiple value propositions visually. Text is fully editable and ready to customize immediately.
Usage Points
-
Main Usage
Categorizes and visually emphasizes core value items of science experiment programs and educational institutions using hexagon nodes. The central hub-focused cluster structure effectively represents relationships where multiple elements converge into a single core concept. Suitable for program introductions, value propositions, organizational role explanations, and diverse presentation scenarios.
-
How to Use
Double-click each hexagon node text to enter item names. Icons can be replaced via the Insert tab or retained as-is. The 2-slide set differs only in color scheme—select either the cyan-blue-green version or the purple-blue-red version to match your presentation topic. Optimized for 16:9 widescreen format.
-
Recommended For
Science education institutions, university research labs, corporate training teams, science centers, museums, educational publishers, and online learning platforms. Effective for presenting experiment programs, educational value, learning objectives, and organizational role distribution.
-
Slide Structure
2-slide set. Each slide features a radial cluster layout with 6 hexagon nodes arranged around a central hub. Slide 1 uses cyan-blue-green tones; Slide 2 uses purple-blue-red tones. Each node contains science-related icons (microscope, beaker, sphere, flask, etc.) with a text description area on the right side.
Related Products
-

Space Exploration Phase-by-Phase Schedule – Visualized with Diagrams
#Product/Service Introduction #Business Strategy #Diagram
-

Introducing the Card Company Service Program – Effective Business Strategy
#Product/Service Introduction #Business Strategy #Diagram
-

Diagram Slide Visualizing Idea Development Stage
#Product/Service Introduction #Business Strategy #Diagram
-

Introducing the Business Partner Project – Impressive Diagram Layout
#Product/Service Introduction #Business Strategy #Diagram
