Graph Slide for Market and Competitor Analysis – Online Market Overview
RJ0700019_10
- Last Update 07/27/2025
- File Size 0.7MB
- # of Slides 2
- File Format PPTX
- Slide Ratio 16:9
- Color
Keywords
- #Content-Based Slides
- #Design-Based Slides
- #Market and Competitor Analysis
- #Diagram
- #Graph
- #Other
- #Competitor Analysis
- #Market Analysis
- #Cluster
- #Closed Cluster Diagram
- #16:9
- #stacked area chart PowerPoint
- #market analysis slide template
- #competitive analysis graph
- #trend analysis chart
- #multi-series area chart PowerPoint
About the Product
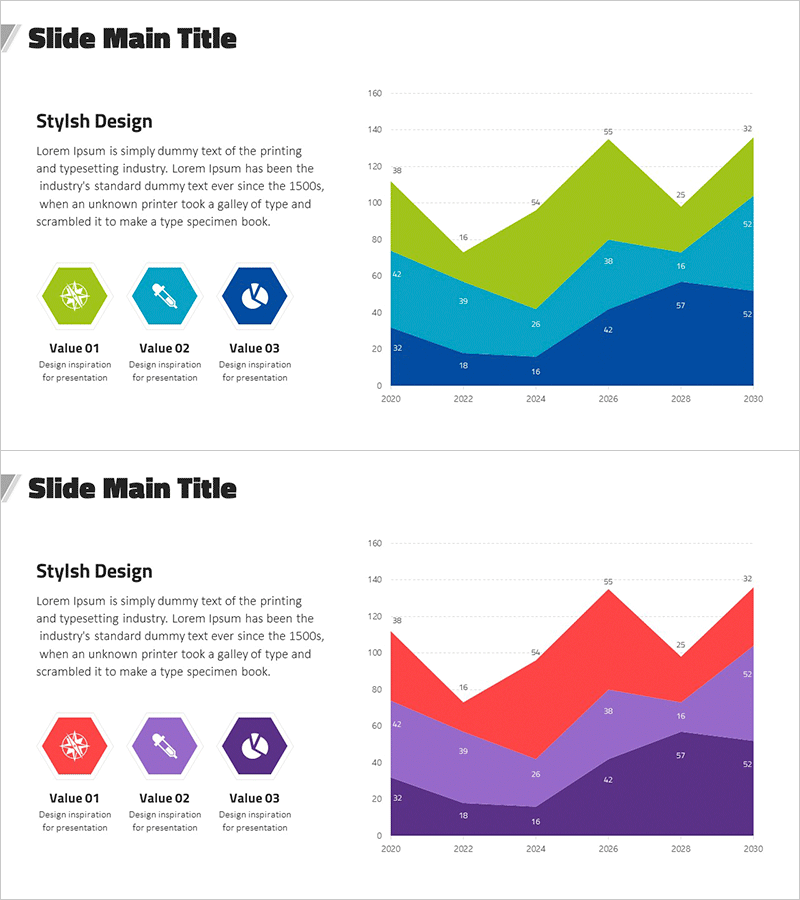
A stacked area chart PowerPoint slide designed for market dynamics and competitive analysis presentations. This 2-slide set visualizes data changes from 2020 to 2030 across three data series, enabling clear representation of market size evolution and competitive landscape shifts over time. The design uses a dark blue, turquoise, and lime green gradient to distinguish each series, with numerical values displayed at each data point for precise information delivery. The left side features a text area and three hexagonal icons to highlight key value propositions, making it ready for immediate use in presentations, reports, and strategic planning documents.
Usage Points
-
Main Usage
Ideal for visualizing market size changes, competitor market share trends, and industry dynamics over time with multiple data series. The stacked area structure simultaneously displays total market volume and individual series proportions, making it highly effective for executive briefings, investor pitches, and strategic planning sessions.
-
How to Use
Slide 1 presents the analysis context with text and icons; Slide 2 displays the stacked area chart covering the 10-year period. Simply replace the chart data with actual figures for immediate presentation use. Colors and legend can be customized to match corporate branding guidelines.
-
Recommended For
Executive and C-suite quarterly business reviews, marketing team market analysis presentations, strategy planning team competitive analysis reports, investor relations pitches, consulting firm industry analysis reports, and academic or seminar presentations.
-
Slide Structure
Slide 1: Title area + body text + 3 hexagonal icons (Value 01–03) layout. Slide 2: Stacked area chart (3 series, X-axis 2020–2030, Y-axis 0–160) + data point values + legend (dark blue, turquoise, lime green). 16:9 widescreen format, PPTX file.
Related Products
-

Spaceship Launch Analysis Graph – Ideal for Competitor Analysis
#Market and Competitor Analysis #Diagram #Graph
-

3 Radial Charts and Analysis – Competitor and Market Trends
#Market and Competitor Analysis #Diagram #Graph
-

Botanic Garden and Bar Chart – Visualization for Market Analysis
#Market and Competitor Analysis #Diagram #Graph
-

Competitor Analysis Broken Line Graph – Visualizing Market Trends
#Market and Competitor Analysis #Diagram #Graph
