Experimental Research Goal Diagram – Visualizing with Cluster Structure
RJ0700019_8
- Last Update 07/27/2025
- File Size 1MB
- # of Slides 2
- File Format PPTX
- Slide Ratio 16:9
- Color
Keywords
- #Content-Based Slides
- #Design-Based Slides
- #Business Vision and Strategy
- #Diagram
- #Business Goals
- #Cluster
- #Closed Cluster Diagram
- #16:9
- #cluster diagram PowerPoint
- #closed-structure diagram slide
- #4-node relationship diagram
- #experimental research goal visualization
- #hexagon diagram PowerPoint template
About the Product
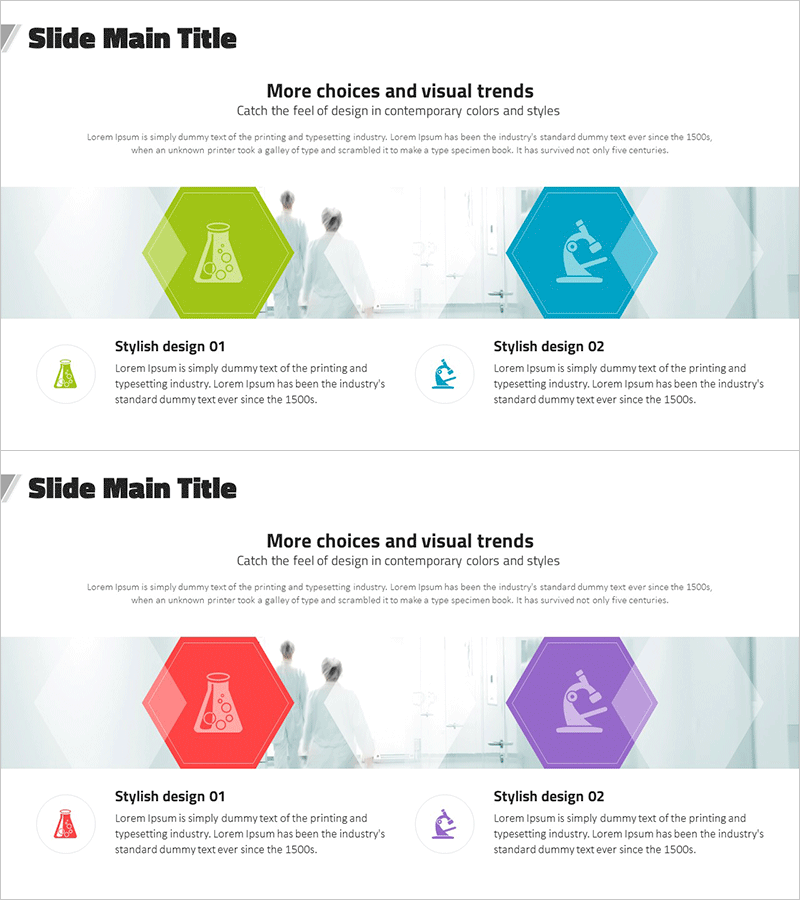
A cluster diagram PowerPoint slide designed to visualize experimental research goals and objectives. The diagram features a closed-structure layout with four hexagonal nodes arranged symmetrically around a central concept, using lime green and teal color contrast to clearly distinguish each element and their relationships. The 2-slide set includes an overview slide showing the complete structure and a detailed slide with icons and text areas for individual item descriptions. Ready-to-use presentation material for scientific, technical, and academic presentations.
Usage Points
-
Main Usage
Visualizes experimental research goals and their relationships using a closed-structure cluster layout. Four elements arranged symmetrically around a central concept create a balanced information hierarchy, making complex interdependencies clear in scientific, technical, and academic presentations.
-
How to Use
Present the overall structure on the first slide as an overview, then explain detailed content for each node on the second slide. Replace hexagon icons and text with your research items for immediate use. Colors can be adjusted to match your institution's branding or presentation theme while maintaining the closed-structure layout.
-
Recommended For
Graduate students, researchers, scientists, and technical professionals presenting thesis research, research results, and technical seminars. Also suitable for executives and planners needing to illustrate product development processes, organizational goal analysis, and business strategy relationships.
-
Slide Structure
2-slide set. Slide 1: Four hexagons arranged symmetrically (top, bottom, left, right) around a central node in closed-structure formation. Slide 2: Same four hexagons positioned on the left with corresponding icons, titles, and description text areas on the right. 16:9 widescreen format, PPTX file.
Related Products
-

Diagram Slide for Smart Network Business Goals
#Business Vision and Strategy #Marketing Plan and Strategy #Diagram
-

Newspaper Wide PowerPoint Template Diagram3 - Business Objectives and Strategy
#Business Vision and Strategy #Diagram #Business Goals
-

Cluster Diagram Template for VR System Goals
#Product/Service Introduction #Business Vision and Strategy #Diagram
-

Abstract Pattern Template for Business Vision – Effective Cluster Structure
#Business Vision and Strategy #Diagram #Business Vision
