Experimental Core Competency Diagram – Establishing Effective Marketing Strategies
RJ0700019_9
- Last Update 07/27/2025
- File Size 1.5MB
- # of Slides 2
- File Format PPTX
- Slide Ratio 16:9
- Color
Keywords
- #Content-Based Slides
- #Design-Based Slides
- #Business Vision and Strategy
- #Marketing Plan and Strategy
- #Diagram
- #Core Competencies
- #Marketing Strategy
- #Cluster
- #Closed Cluster Diagram
- #16:9
- #closed-form diagram PowerPoint
- #core competency diagram slide
- #3-node structure presentation
- #marketing strategy diagram
- #diagram PowerPoint slide template
About the Product
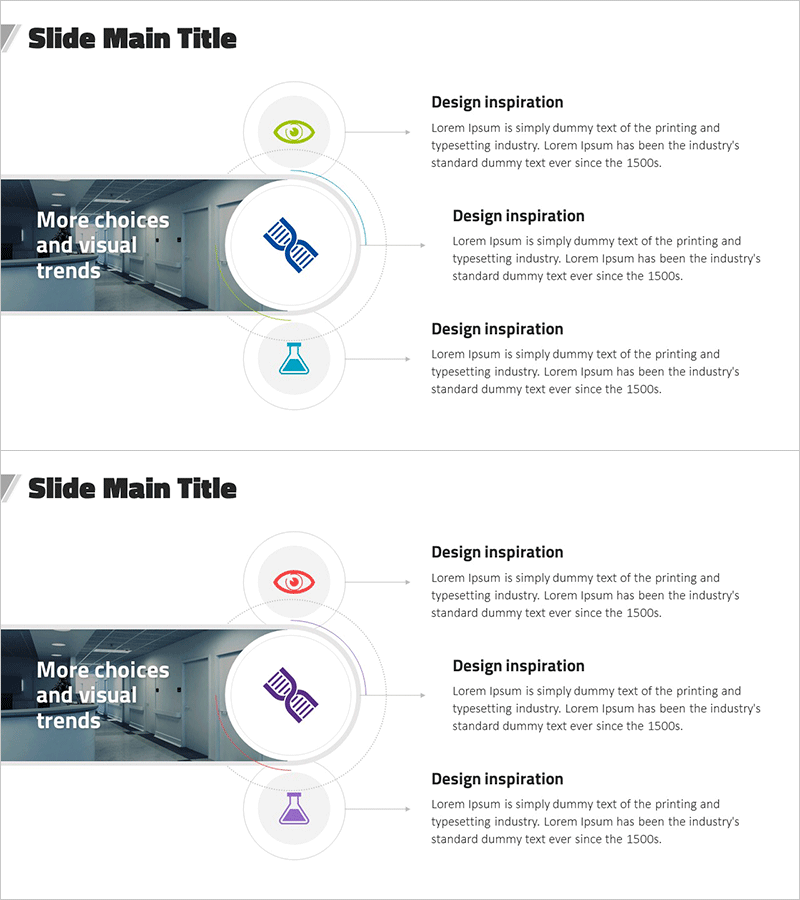
A closed-form diagram PowerPoint slide optimized for marketing strategy development and core competency analysis. The design features a central concept connected to three circular nodes, each containing an icon and text description area. A gray background image element combined with colorful icons (green eye, blue chart, blue flask) creates visual hierarchy. Composed of 2 slides in 16:9 aspect ratio in editable PPTX format. Systematically presents three key elements such as organizational competitive advantage, business strategy, and product differentiation. Ideal for strategy presentations, proposal documents, and executive reports requiring clear visualization of relationships between core concepts and supporting details.
Usage Points
-
Main Usage
Visually integrates three key organizational elements—core competitive advantages, business strategy, and product differentiation—into a unified diagram. Effectively communicates relationships between central concepts and supporting details in marketing plans, business proposals, and strategic reports.
-
How to Use
Enter the main concept (e.g., brand value, business objective) in the center, then populate the three circular nodes with supporting details (e.g., technology, market potential, customer satisfaction). Customize node icons to match organizational branding and add descriptive text to complete the diagram.
-
Recommended For
Marketing professionals, strategic planning teams, business development managers, consultants, and executives preparing strategy documentation and competitive analysis presentations.
-
Slide Structure
Two-slide layout with each slide featuring a central image area and three circular nodes arranged around it. Each node contains an icon placeholder and text description field. First slide uses green and blue icons; second slide features red and purple icon variations for visual differentiation.
Related Products
-

Core Technology Plus Diagram - Presenting Business Strategy and Vision
#Business Vision and Strategy #Marketing Plan and Strategy #Diagram
-

Core Technology Detail Plan Diagram – Strengthening Business Strategies through Clusters
#Business Vision and Strategy #Marketing Plan and Strategy #Diagram
-

Core Competency Diagram – Visualizing Business Vision and Marketing Strategy
#Business Vision and Strategy #Marketing Plan and Strategy #Diagram
-

Collaborative Business Detail Plan Diagram – Marketing Strategy and Vision
#Business Vision and Strategy #Marketing Plan and Strategy #Diagram
