Introduction to Types of Chemical Experiments – Effective Information Delivery
RJ0700019_21
- Last Update 07/27/2025
- File Size 1.1MB
- # of Slides 2
- File Format PPTX
- Slide Ratio 16:9
- Color
Keywords
About the Product
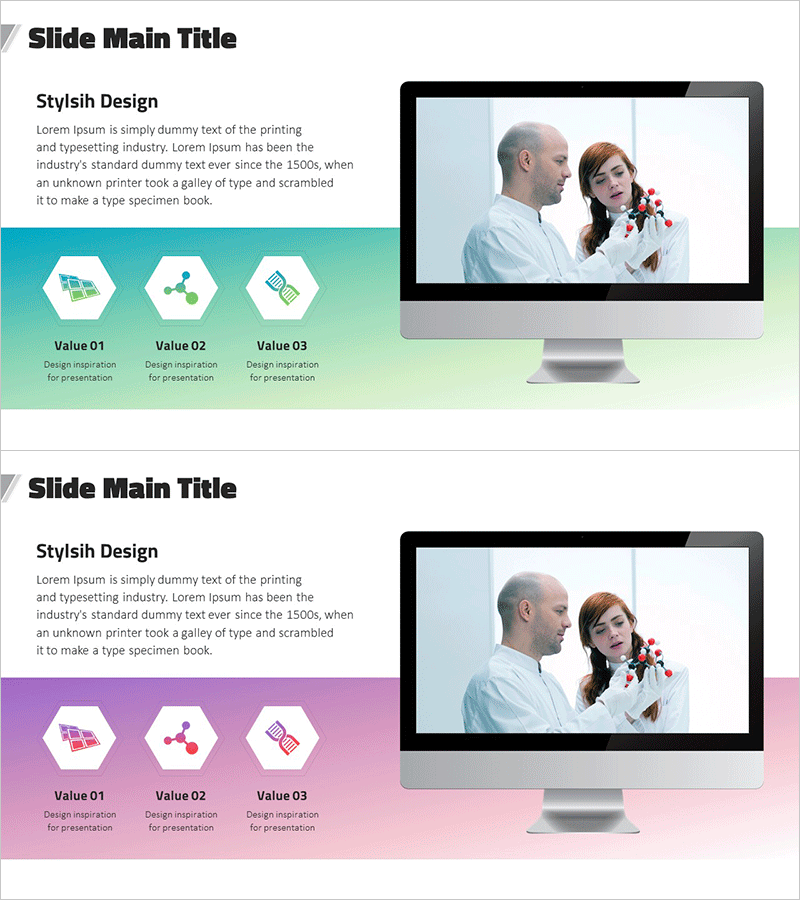
A cluster diagram PowerPoint slide featuring three hexagon shapes arranged to show interconnected relationships. Available in two color versions—turquoise and pink—each hexagon contains icons and text labels for clear information organization. This 2-slide PPTX template in 16:9 widescreen format effectively visualizes how three related items, concepts, or categories connect and interact. Perfect for comparing chemical experiment types, product features, service categories, or organizational relationships. Fully editable and ready to integrate into business presentations, educational materials, and planning documents.
Usage Points
-
Main Usage
Designed to visually represent the interconnected relationships between three related items, concepts, or categories. Ideal for explaining chemical experiment types, product core features, service classifications, or organizational roles with equal emphasis on each element while highlighting their mutual interactions and dependencies.
-
How to Use
Edit the text and icons within each hexagon to match your content. Use the turquoise version for technical, scientific, or professional presentations requiring credibility and expertise. Choose the pink version for creative, marketing-focused, or innovation-driven presentations. Colors, shapes, and text are fully customizable to match your brand guidelines.
-
Recommended For
Science and technology education materials, chemistry or biology experiment explanations, product feature comparisons, service category introductions, marketing strategy presentations, organizational structure diagrams, team role descriptions, business model explanations, and concept relationship visualizations.
-
Slide Structure
Two slides with consistent layout: title and descriptive text on the left or center, three hexagon shapes on the right. Each hexagon contains an icon and label text, with connecting lines showing relationships between elements. Optimized for 16:9 widescreen format for modern presentation environments and digital displays.
Related Products
-

Business Service Composition Diagram – Intuitive Visualization and Strategic Guidance
#Business Vision and Strategy #Technical Approach #Diagram
-

Graph Slide for Market and Competitor Analysis – Online Market Overview
#Market and Competitor Analysis #Diagram #Graph
-

Competitive Strengths Comparison Chart – An Effective Market Analysis Tool
#Product/Service Introduction #Market and Competitor Analysis #Diagram
-

Ratio Infographic Analysis Chart – Optimized for Market Analysis
#Market and Competitor Analysis #Diagram #Graph
