Experimental Area Description Slide - Analysis and Visualization
RJ0700019_25
- Last Update 08/29/2025
- File Size 1MB
- # of Slides 2
- File Format PPTX
- Slide Ratio 16:9
- Color
Keywords
- #Content-Based Slides
- #Design-Based Slides
- #Company Introduction
- #Business Introduction
- #Diagram
- #Business Areas
- #Business Areas
- #Spread
- #Decentralized Diagram
- #16:9
- #hexagon diagram PowerPoint
- #radial diagram slide template
- #4-node diagram
- #data visualization PowerPoint
- #business analysis slide
- #presentation template download
About the Product
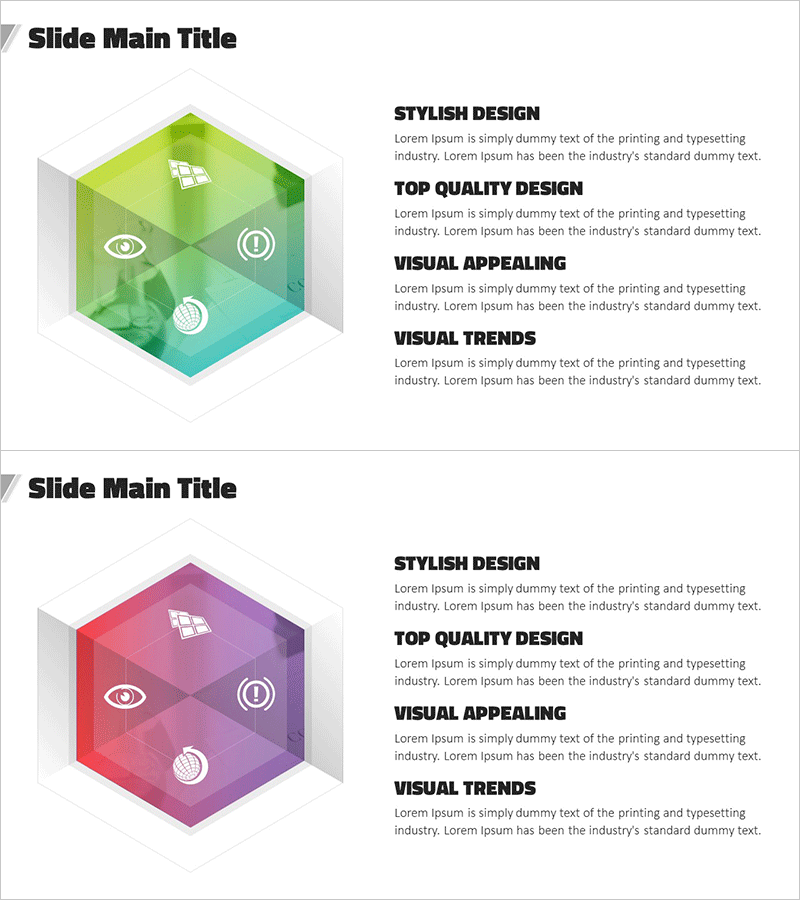
A PowerPoint slide featuring a central hexagon with four nodes radiating outward in a symmetrical pattern. The first slide displays a green-to-teal gradient background, while the second features a pink-to-purple gradient. Each node is equipped with an icon for visual clarity. This 16:9 PPTX template is ideal for business analysis, data visualization, experimental area descriptions, and strategic presentations. Fully editable and ready to customize for immediate use in professional presentations.
Usage Points
-
Main Usage
Visualizes a central concept expanding into four key elements or categories. Ideal for business analysis, experimental area explanations, strategic breakdowns, and data classification in professional presentations.
-
How to Use
Enter your main topic in the central hexagon and add details to each of the four nodes. Customize the icons to match your content, adjust the gradient colors to align with corporate branding, or maintain the existing color scheme. Insert into company overview, product introduction, or marketing strategy slides.
-
Recommended For
Executives, marketing teams, data analysts, consultants, and educators presenting business strategies, analytical reports, and strategic initiatives. Particularly effective when emphasizing four core elements or components.
-
Slide Structure
Two-slide set. First slide features green-to-teal gradient with central hexagon and four-node radial structure. Second slide displays pink-to-purple gradient with identical layout. Four icons positioned at nodes, five text input areas total (one central, four at nodes).
Related Products
-

Business Area Connection Diagram – Exploring Business Domains
#Company Introduction #Business Introduction #Diagram
-

Business Science Diffusion Diagram – Non-Central Connection
#Company Introduction #Business Introduction #Diagram
-

Main Business Areas Triangle Diagram
#Company Introduction #Business Introduction #Diagram
-

Core Business Area Diagram – Segmentation and Expansion
#Company Introduction #Business Introduction #Diagram
