Experimental Configuration Content Circle Graph
RJ0700019_12
- Last Update 07/27/2025
- File Size 0.8MB
- # of Slides 2
- File Format PPTX
- Slide Ratio 16:9
- Color
Keywords
- #Content-Based Slides
- #Design-Based Slides
- #Product/Service Introduction
- #Technical Approach
- #Diagram
- #Graph
- #Composition
- #Research and Development
- #Cluster
- #Circles
- #Closed Cluster Diagram
- #Doughnut Chart
- #16:9
- #donut chart PowerPoint slide
- #pie chart template
- #data ratio visualization
- #circular graph presentation
- #composition diagram PowerPoint
About the Product
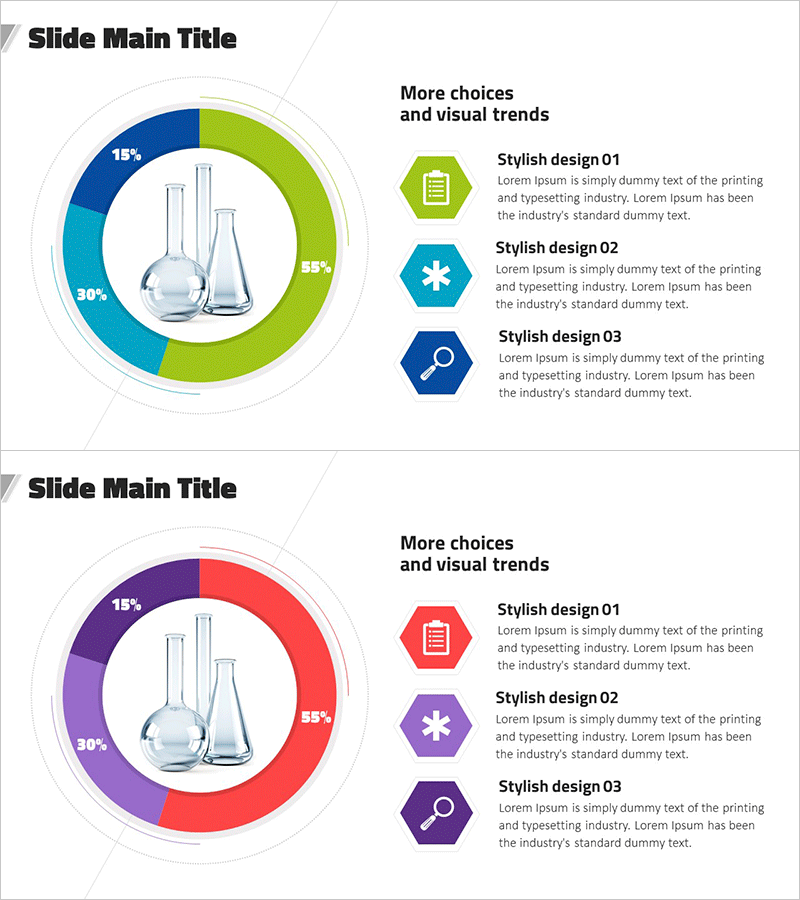
A donut-shaped pie chart PowerPoint slide that divides experimental configuration content into three sections with distinct visual representation. The design features a central image area surrounded by a donut chart in blue, green, and teal colors, clearly displaying composition ratios with percentage labels. Three hexagonal text boxes on the right side allow detailed descriptions for each section, making it ideal for technical presentations, research reports, and product composition explanations. The 2-slide set offers varied color combinations so you can select the version that best matches your presentation theme and tone.
Usage Points
-
Main Usage
Effectively communicate the composition and proportional breakdown of experiments, products, or projects. The central image area emphasizes your core topic while the surrounding donut sections provide analytical detail about each component.
-
How to Use
Modify the donut chart sections, colors, and percentages to match your actual data. Replace the center image with a relevant photo for your topic, then fill in the three hexagonal text boxes on the right with descriptions, statistics, and explanations for each section.
-
Recommended For
Researchers, engineers, and technical professionals in science, technology, medical, and manufacturing fields presenting experimental results or product structures. Also suitable for marketing and business professionals visualizing market composition, customer demographics, or business portfolio breakdowns.
-
Slide Structure
Left side displays a donut chart (3 sections with example percentages of 15%, 30%, and 55%) surrounding a central circular image area. Right side features three vertically-aligned hexagonal text boxes for section descriptions. Both slides share identical layouts with only color scheme variations for flexible presentation styling.
Related Products
-

Spaceship Configuration Contents PowerPoint Template – Scientific Approach and Creativity
#Company Introduction #Product/Service Introduction #Diagram
-

Modern Wide PowerPoint Template Donut Chart - Visualizing Revenue Model
#Product/Service Introduction #Business Introduction #Diagram
-

Healthcare Technology PowerPoint – 4 Feature Cards with KPI
#Product/Service Introduction #Technical Approach #Diagram
-

Analysis of Smart Network Systems – Data Visualization for Innovation
#Product/Service Introduction #Diagram #Graph
