Experimental Results Summary Diagram
RJ0700019_18
- Last Update 07/27/2025
- File Size 0.8MB
- # of Slides 2
- File Format PPTX
- Slide Ratio 16:9
- Color
Keywords
- #Content-Based Slides
- #Design-Based Slides
- #Business Vision and Strategy
- #Marketing Plan and Strategy
- #Diagram
- #Business Goals
- #Marketing Objectives
- #Cluster
- #Closed Cluster Diagram
- #16:9
- #cluster diagram PowerPoint
- #triangle diagram slide
- #3-item comparison template
- #comparison analysis presentation
- #PowerPoint diagram slide design
About the Product
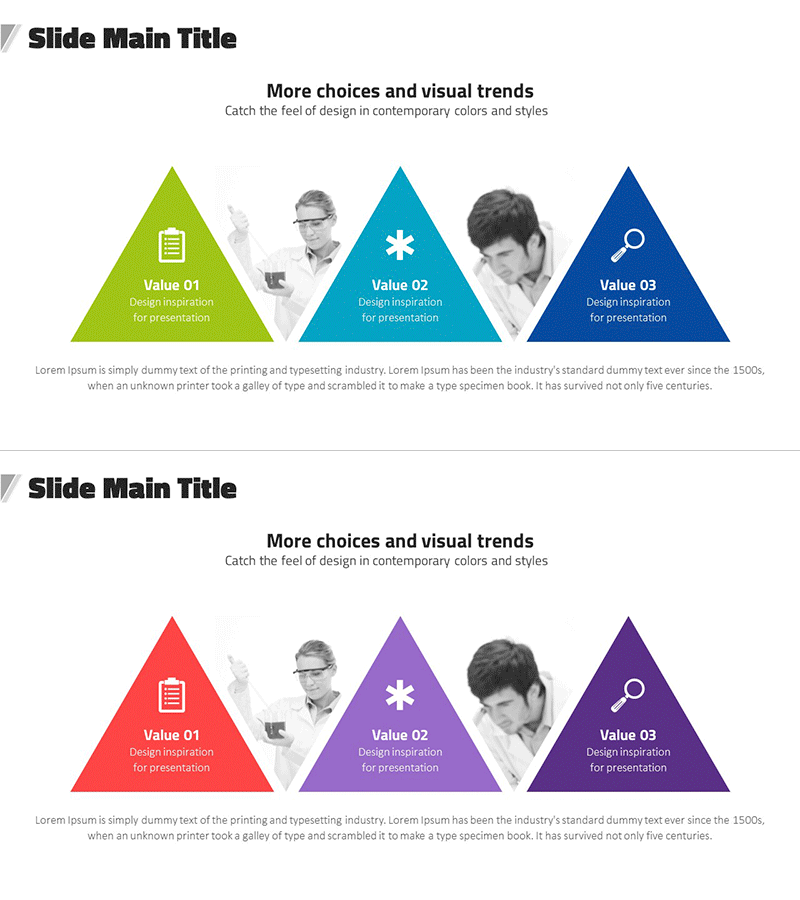
A PowerPoint cluster diagram slide featuring three triangular shapes in lime green, turquoise, and navy blue, arranged with central portrait images to visually represent three key values or characteristics. Each triangle contains an icon and text area for presenting product features, marketing strategies, business vision, or comparative analysis. The 2-slide set offers two color variations (green-turquoise-navy and red-purple-dark purple) to match your presentation theme and audience. Designed in 16:9 widescreen format as an editable PPTX file, enabling quick customization and immediate use in business presentations.
Usage Points
-
Main Usage
Presents three core elements with equal visual weight, emphasizing each item's distinct value through geometric triangular shapes and color contrast. The central portrait images reinforce integration and human-centered messaging, making it ideal for strategic comparisons and value propositions.
-
How to Use
Enter item names, descriptions, and key messages in the text areas within each triangle. Replace icons to symbolically represent each item's characteristics. Choose between two color schemes or customize colors to match your brand identity and presentation tone.
-
Recommended For
Product managers, marketing professionals, and strategy teams presenting three core strategies, values, or product features simultaneously. Suitable for business vision presentations, marketing strategy workshops, product feature comparisons, organizational role definitions, and competitive positioning.
-
Slide Structure
2-slide set with identical layouts. Each slide contains 3 equidimensional triangular shapes, each with an embedded icon (16x16px minimum), item title text box, and descriptive text area. Three portrait images are centrally positioned to connect with each triangle. Slide 1 uses green-turquoise-navy palette; Slide 2 uses red-purple-dark purple palette.
Related Products
-

Marketing Objectives Closed Diagram - Setting Goals with Visual Approach
#Business Vision and Strategy #Marketing Plan and Strategy #Diagram
-

Setting Successful Business Goals – Diagram for Strategy and Growth
#Business Vision and Strategy #Marketing Plan and Strategy #Diagram
-

Visualize Business Goals and Strategies with Cloud Shape Closure Diagram
#Business Vision and Strategy #Marketing Plan and Strategy #Diagram
-

Fintech Business Goals Diagram – Implementing Marketing Strategy
#Business Vision and Strategy #Marketing Plan and Strategy #Diagram
