Visualizing User Analysis Data Results with Cluster Diagram Slide
RJ0700019_17
- Last Update 07/27/2025
- File Size 0.7MB
- # of Slides 2
- File Format PPTX
- Slide Ratio 16:9
- Color
Keywords
- #Content-Based Slides
- #Design-Based Slides
- #Market and Competitor Analysis
- #Diagram
- #Graph
- #Other
- #Customer Analysis
- #Cluster
- #Closed Cluster Diagram
- #16:9
- #cluster diagram PowerPoint
- #user analysis presentation
- #overlapping diagram slide
- #customer analysis PPT
- #data visualization PowerPoint
- #diagram slide template
About the Product
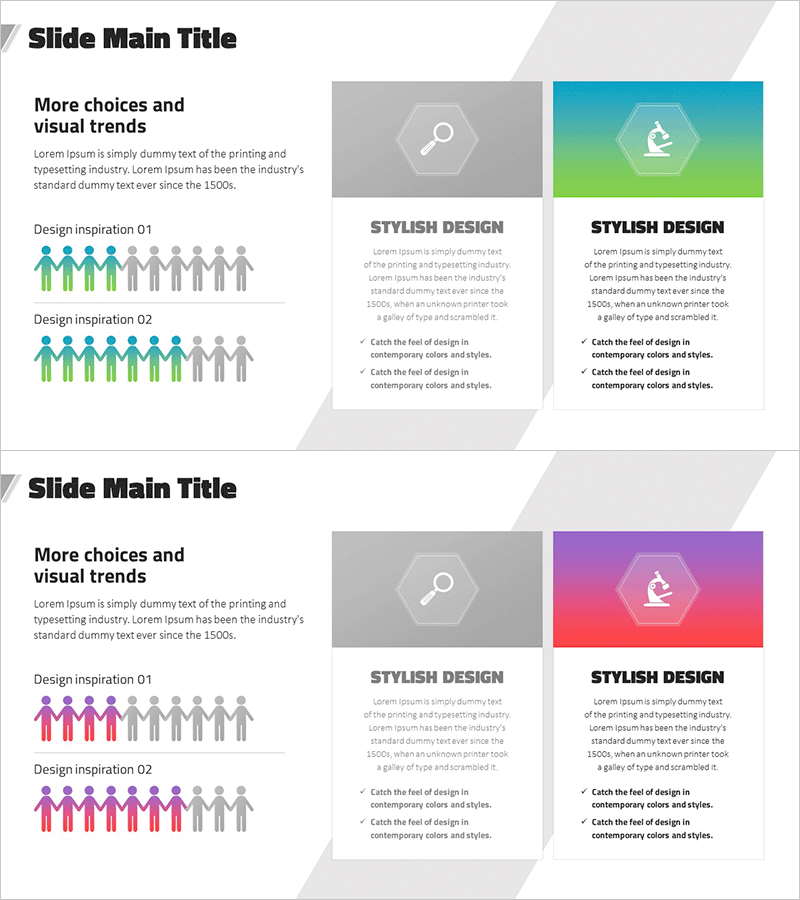
A PowerPoint slide featuring a cluster diagram that visualizes user analysis data and results. The design uses three overlapping hexagonal areas to represent relationships and intersections between user segments, with icons and text placed in each area to convey customer analysis findings intuitively. Composed of 2 slides in 16:9 widescreen format, it offers two color versions: turquoise-to-green gradient and purple-to-pink gradient. This presentation template is ideal for marketing plans, market analysis reports, and customer segmentation presentations where data structure needs to be clearly communicated.
Usage Points
-
Main Usage
Visualizes relationships and intersections between user segments to clearly communicate customer analysis results. Effective for marketing plans showing target customer characteristics and overlapping demographics, or market analysis reports illustrating intersection points between competitors, customers, and market opportunities.
-
How to Use
Enter customer segment names (e.g., office workers, students, entrepreneurs) in each hexagonal area, and add common characteristics in the central intersection zone. Modify icons and text to match your actual analysis data, then use as presentation material for stakeholder meetings.
-
Recommended For
Recommended for marketing managers, planners, data analysts, and executives presenting customer analysis, market analysis, or competitive analysis results. Highly applicable in market analysis sections of business plans, marketing proposals, and investor pitch decks.
-
Slide Structure
Consists of 2 slides, each featuring 3 overlapping hexagonal areas with a central intersection zone. Layout includes text description area on the left and color-gradient background diagram on the right. Two color options provided: turquoise-to-green version and purple-to-pink version for design flexibility.
Related Products
-

Business Customer Analytics Slide – Strategic Insights
#Business Vision and Strategy #Market and Competitor Analysis #Diagram
-

Human Resources Data Analysis - Effective Customer Management Strategies
#Company Introduction #Market and Competitor Analysis #Diagram
-

Key Customer Analysis Data Charts – Assessing Market and Competition
#Company Introduction #Market and Competitor Analysis #Diagram
-

Introducing Medical Staff Analysis Data – Insights from Experts
#Company Introduction #Market and Competitor Analysis #Diagram
