Experimental Results Summary Diagram – Business Vision and Strategy
RJ0700019_11
- Last Update 07/27/2025
- File Size 1.4MB
- # of Slides 2
- File Format PPTX
- Slide Ratio 16:9
- Color
Keywords
- #Content-Based Slides
- #Design-Based Slides
- #Product/Service Introduction
- #Business Vision and Strategy
- #Diagram
- #Program Introduction
- #Business Goals
- #Cluster
- #Closed Cluster Diagram
- #16:9
- #hexagon diagram PowerPoint
- #cluster diagram slide template
- #3-item closed structure
- #business strategy diagram
- #PowerPoint slide design download
About the Product
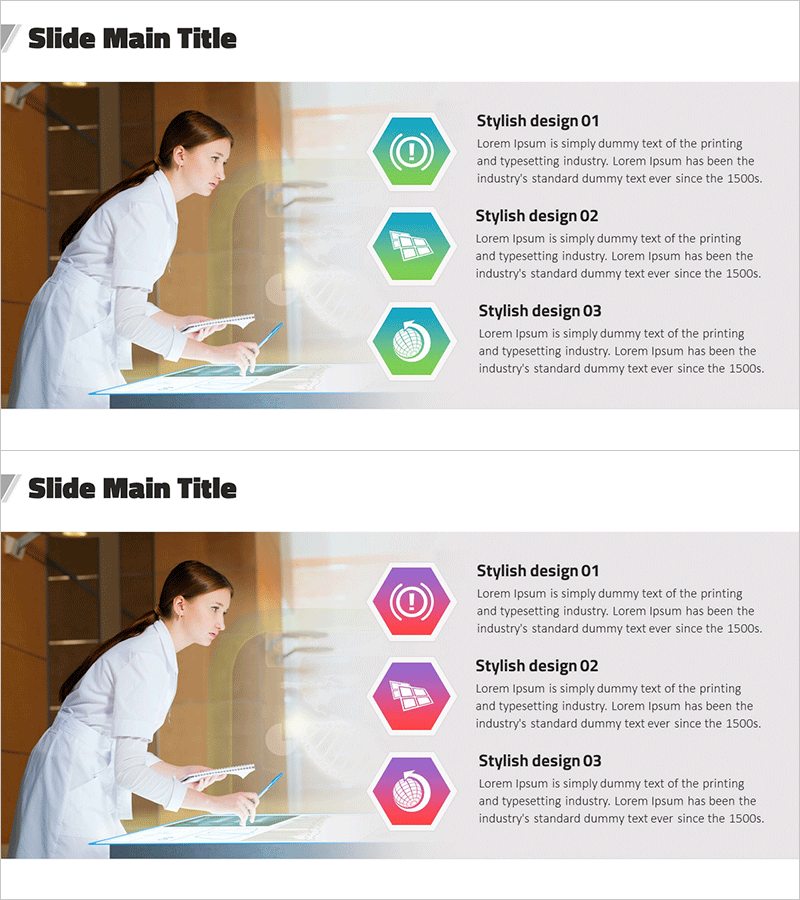
A 3-item hexagon cluster diagram PowerPoint slide for organizing business vision and strategy. Features teal, purple, and teal-to-green gradient hexagon icons arranged on the left, with dedicated title and description text areas on the right for each item. Ideal for presenting experimental results, strategic frameworks, and core business elements in professional presentations. The 2-slide set includes color variations (teal, purple, and gradient palettes) in 16:9 widescreen PPTX format, allowing flexible customization for different presentation contexts.
Usage Points
-
Main Usage
Visualizes business vision, strategy, and key elements across 3 distinct items using a closed-structure cluster diagram. The hexagon icons and text areas are clearly separated, enabling intuitive communication of item titles and detailed descriptions. Suitable for presenting experimental results, organizational roles, strategic analysis, and core business concepts.
-
How to Use
Enter item titles in the text area next to each hexagon icon and add detailed descriptions below. Utilize the color-variant slides (teal, purple, gradient) to differentiate presentation sections or topics. Both icons and text elements are independently editable, allowing full customization to match your presentation theme.
-
Recommended For
Recommended for business plans, strategy reports, experimental result presentations, and organizational overview decks where key elements need emphasis. Ideal for executives, project leaders, researchers, and marketing professionals presenting strategic frameworks, analytical findings, and organizational structures.
-
Slide Structure
2-slide set with identical layouts and color variations. Each slide features 3 hexagon icons positioned on the left with corresponding title and description text areas on the right. Slide 1 uses teal-to-green gradient, Slide 2 uses purple-to-pink gradient, providing visual variety while maintaining consistent structure.
Related Products
-

Setting Financial Business Goals
#Product/Service Introduction #Business Vision and Strategy #Diagram
-

How to Solve Insomnia Presentation Slide Template – Stress Relief
#Product/Service Introduction #Business Vision and Strategy #Diagram
-

Introducing the Securities Service Program – Innovation and Goal Achievement
#Product/Service Introduction #Business Vision and Strategy #Diagram
-

Introducing the Startup Business Program – Innovation and Growth
#Product/Service Introduction #Business Vision and Strategy #Diagram
