Market Analysis Table Chart for Clear Market Overview
RJ0700005_29
- Last Update 07/22/2025
- File Size 0.2MB
- # of Slides 2
- File Format PPTX
- Slide Ratio 16:9
- Color
Keywords
About the Product
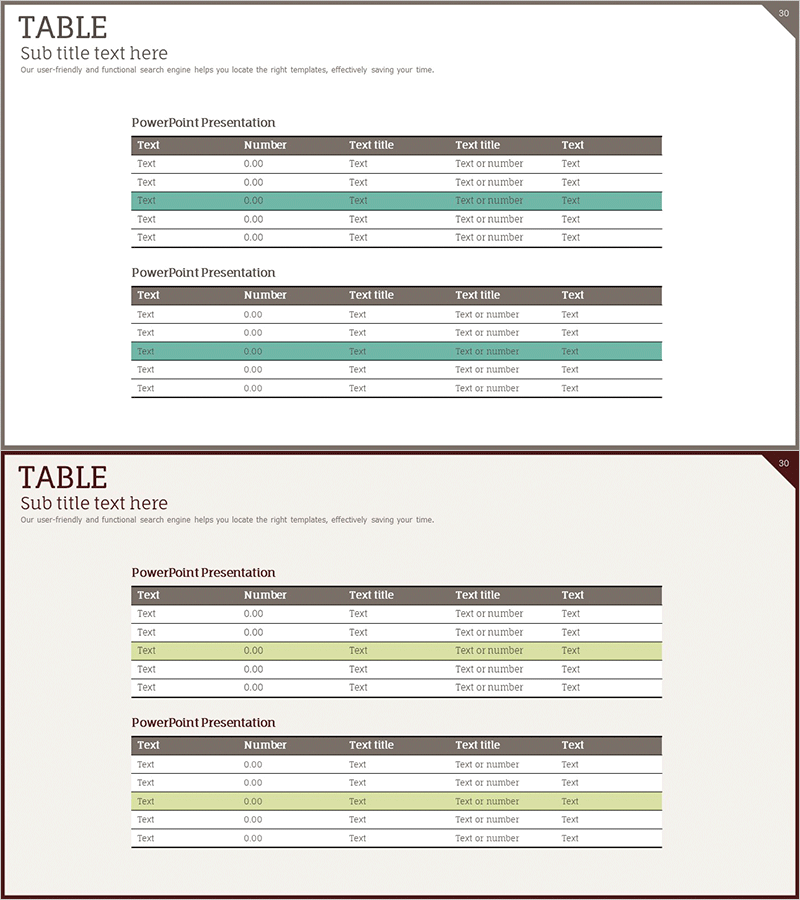
A table-formatted PowerPoint slide that presents market overview data at a glance. This 2-slide set organizes various market analysis information in table format, ready for immediate use in presentations. The structure divides text, numbers, and categories across 5 columns, optimized for conveying quantitative information such as market trends, competitor analysis, and product comparisons. Gray headers and teal-highlighted rows visually distinguish important data, while the 16:9 widescreen PPTX format allows instant editing and customization.
Usage Points
-
Main Usage
Clearly convey quantitative data such as market overview, competitor analysis, and product comparison in table format. The 5-column structure enhances information readability and serves as supporting evidence for decision-making.
-
How to Use
Insert into the market analysis section of business plans, marketing proposals, or investor pitch decks. Replace header text and data rows with your own information, and use teal highlight rows to emphasize key metrics and increase audience attention.
-
Recommended For
Marketing managers, planning teams, and executives presenting market analysis results. Particularly effective for situations requiring multi-item comparisons such as competitor benchmarking, market share comparison, and product performance evaluation.
-
Slide Structure
2-slide set with each slide containing 5 columns (text, number, text, text, text) and 5-6 data rows. Information hierarchy is expressed through gray header rows and alternating white and teal highlight rows, with black bottom borders clearly defining table boundaries.
Related Products
-

Cement Theme Bar Graph & Table
#Market and Competitor Analysis #Diagram #Graph
-

Type Comparison Analysis Graph & Table – Effective Tool for Market Analysis
#Market and Competitor Analysis #Diagram #Graph
-

Competitor Market Analysis Table – Strategic Insights
#Market and Competitor Analysis #Diagram #Graph
-

Goal Setting & Radial Graph – Intuitive Data Visualization
#Business Introduction #Market and Competitor Analysis #Diagram
