Development Status Donut-shaped Circle Graph
RJ0700005_19
- Last Update 07/22/2025
- File Size 0.3MB
- # of Slides 2
- File Format PPTX
- Slide Ratio 16:9
- Color
Keywords
- #Content-Based Slides
- #Design-Based Slides
- #Product/Service Introduction
- #Market and Competitor Analysis
- #Graph
- #Development Status
- #Market Share
- #Circles
- #Doughnut Chart
- #16:9
- #donut chart PowerPoint slide
- #pie chart presentation template
- #percentage data visualization
- #circular graph slide
- #business data visualization
About the Product
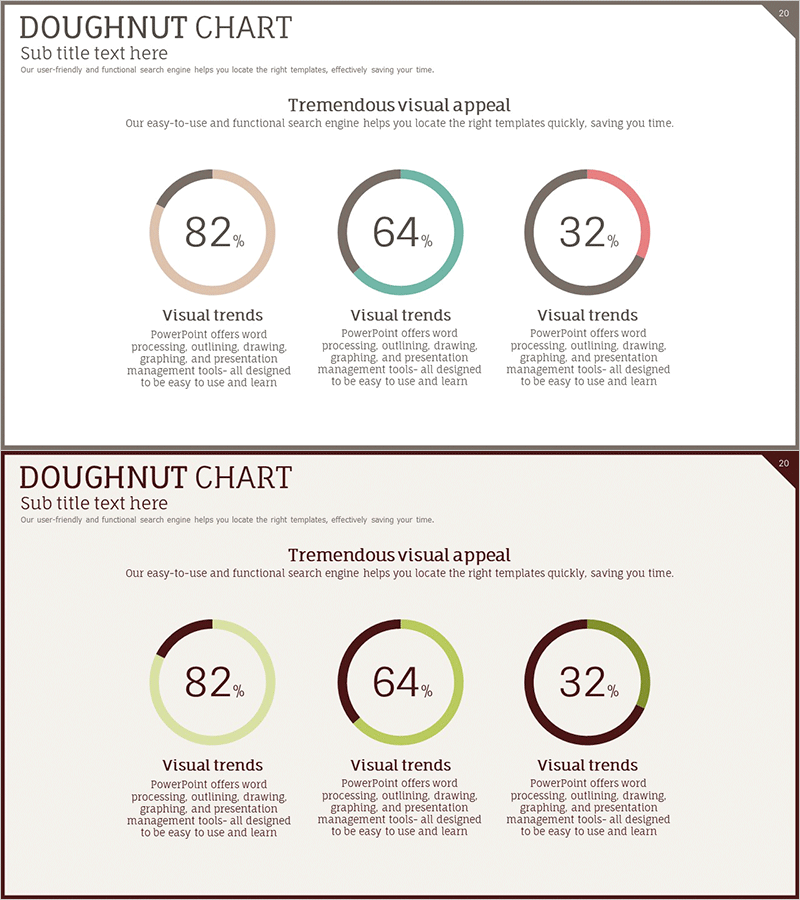
A professional donut chart PowerPoint slide designed to visualize ratio data such as market share, development status, and competitive analysis. This 2-slide set offers two distinct color schemes (beige, teal, pink / lime, olive, burgundy) that can be customized to match your presentation theme and corporate branding. Each slide features a 3-segment donut chart with percentage data clearly displayed, and a central circular area for adding key messages or supplementary information. The template effectively communicates statistical data, composition ratios, and market analysis results in business presentations.
Usage Points
-
Main Usage
Display ratio data and composition percentages at a glance using a donut chart format. Ideal for visualizing market share, development progress, customer satisfaction, competitive positioning, and budget allocation across 3 categories. The central circular area allows you to emphasize key metrics or conclusions, increasing audience engagement.
-
How to Use
Input your actual data values into each donut chart segment and update the legend labels with your category names. Add key statistics or conclusions to the central circular area to enhance emphasis and impact. Select the color scheme that best matches your presentation topic and corporate brand identity for visual consistency.
-
Recommended For
Recommended for marketing plans, business reports, market analysis documents, investor pitch decks, and executive briefings. Ideal for professionals including executives, marketing managers, data analysts, and business planners who need to communicate quantitative ratio information clearly and persuasively.
-
Slide Structure
2-slide set. Each slide contains one 3-segment donut chart with percentage values, category legends, and a central circular emphasis area. Slide 1 uses beige, teal, and pink; Slide 2 features lime, olive, and burgundy. Both layouts are fully editable and adaptable to various business contexts.
Related Products
-

Space Exploration Donut Pie Chart
#Product/Service Introduction #Market and Competitor Analysis #Graph
-

Analysis graph of market share progress
#Product/Service Introduction #Market and Competitor Analysis #Graph
-

City Theme Market Share Graph – Business Data Visualization
#Product/Service Introduction #Market and Competitor Analysis #Graph
-

Sales Status Analysis Graph – Simple and Stylish Design
#Product/Service Introduction #Market and Competitor Analysis #Graph
