Graph Charts for Systematic Market Analysis – Bar and Pie Charts
RJ0700005_9
- Last Update 07/23/2025
- File Size 0.3MB
- # of Slides 2
- File Format PPTX
- Slide Ratio 16:9
- Color
Keywords
- #Content-Based Slides
- #Design-Based Slides
- #Technical Approach
- #Market and Competitor Analysis
- #Diagram
- #Graph
- #Research and Development
- #Market Analysis
- #Table
- #Horizontal Bar
- #Circles
- #Standard Table
- #Segmented Horizontal Bar
- #Pie Chart
- #16:9
- #pie chart PowerPoint slide
- #horizontal bar graph template
- #data comparison chart
- #market analysis graph
- #ratio visualization slide
- #PowerPoint chart template download
About the Product
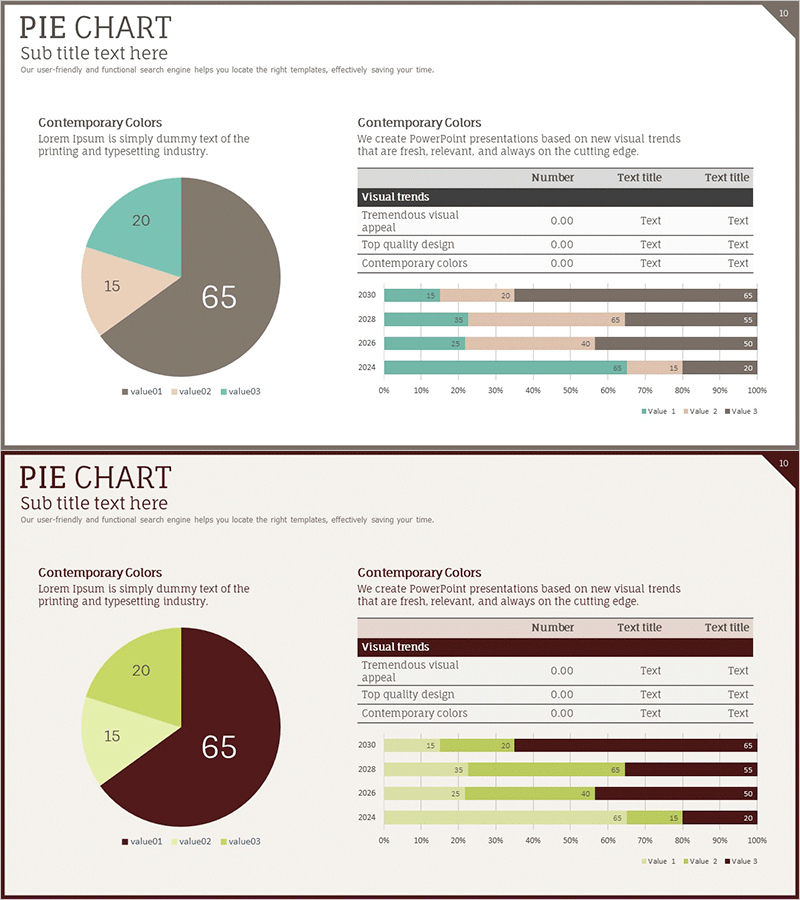
A PowerPoint slide set designed for market analysis and data comparison presentations. The pie chart displays the ratio of three items, while the horizontal bar graph compares three data series across four years. The contemporary color palette features terracotta, gray, and teal tones, creating a professional appearance. Each slide includes descriptive text areas and legends, allowing you to input data and present immediately. These PPT slides are suitable for marketing reports, sales presentations, executive briefings, and various business communications.
Usage Points
-
Main Usage
Visualize market share, product composition, and customer distribution using the pie chart, while comparing year-over-year, regional, or categorical data with the horizontal bar graph. Ideal for executive reports, marketing analysis, sales performance presentations, and any business communication requiring clear data visualization.
-
How to Use
On slide 1, enter the three pie chart item names and values. On slide 2, modify the years, series names, and data values for the horizontal bar graph. Maintain the terracotta, gray, and teal color scheme, or customize with your corporate brand colors. Legends and axis labels update automatically to complete your presentation.
-
Recommended For
Marketing teams presenting market analysis reports, sales teams delivering quarterly performance reviews, executives presenting business status updates, consulting firms preparing client proposals, financial institutions analyzing portfolio data, and any organization requiring data-driven decision-making presentations.
-
Slide Structure
Slide 1: 3-segment pie chart with legend and descriptive text area. Slide 2: 4-year × 3-series horizontal bar graph with legend and data table. Both slides are in 16:9 widescreen format, totaling 2 slides.
Related Products
-

Chemical Experiment Analysis Graph Chart – Visualizing R&D Achievements
#Technical Approach #Market and Competitor Analysis #Diagram
-

Science Experiment Analysis Circular Graph Table Chart – Innovation in Data Visualization
#Business Introduction #Technical Approach #Diagram
-

Market Entry Potential and Expansion Strategy Chart
#Market and Competitor Analysis #Graph #Market Status
-

Business Note Analysis Circle Graph & Table – Market and Competitive Analysis
#Market and Competitor Analysis #Diagram #Graph
