Gender Comparison of Plastic Surgery Experience – Data Visualization
RJ0700005_7
- Last Update 07/23/2025
- File Size 0.6MB
- # of Slides 2
- File Format PPTX
- Slide Ratio 16:9
- Color
Keywords
About the Product
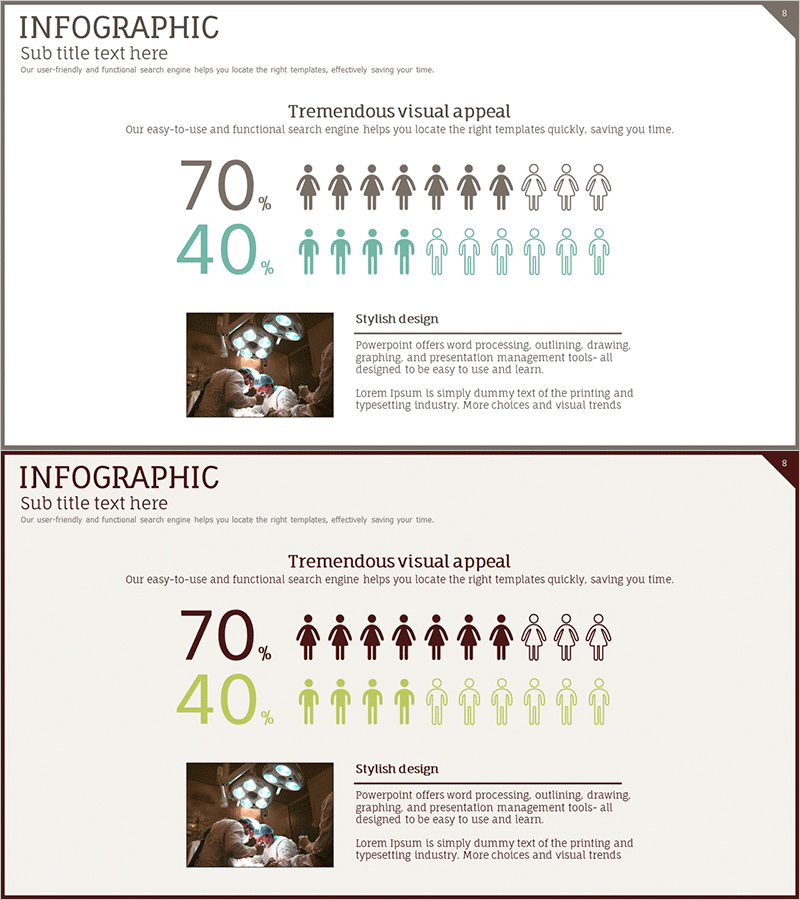
A PowerPoint slide set that visualizes gender comparison data for plastic surgery experience through intuitive infographic design. The 70% and 40% ratios are represented using human icons, making it immediately applicable for customer analysis and market research presentations. The two-tone color scheme of gray and teal backgrounds ensures clear data readability with prominent numerical expressions. The 2-slide composition includes a comparative analysis slide and a detailed explanation area, delivered in 16:9 widescreen PPTX format compatible with all presentation environments. Effectively communicate statistical data in marketing plans, business reports, and customer analysis materials.
Usage Points
-
Main Usage
Designed to communicate gender comparison data intuitively in customer analysis and market research presentations. The human icon-based ratio representation allows complex statistics to be understood at a glance, making it ideal for marketing strategy development and target audience analysis presentations.
-
How to Use
Input your data values into the text areas of the slide and customize colors as needed to match your corporate brand. The first slide focuses on core ratio comparison, while the second slide provides detailed explanation and additional information input areas for comprehensive data presentation.
-
Recommended For
Recommended for marketing teams, research departments, business analysts, and consultants who require data-driven decision-making. Particularly useful for customer segmentation, market research result presentations, business reports, and investor pitch materials.
-
Slide Structure
The 2-slide composition features a first slide with 70% and 40% ratios represented by 10 human icons each in a comparison area, plus title and subtitle text input spaces. The second slide includes detailed explanation text areas and additional image insertion space for supporting information.
Related Products
-

Gender Ratio Comparison in Children – Child Analysis
#Market and Competitor Analysis #Graph #Other
-

Bar Graph Visualizing Elderly Population Ratio
#Market and Competitor Analysis #Graph #Other
-

User Analysis Pictogram Graph – Visualizing Customer Success
#Market and Competitor Analysis #Customer Success Stories #Graph
-

Analysis of the Gender Ratio of Users in the US Market – A Blend of Teal and Gray
#Market and Competitor Analysis #Graph #Other
