Global Target Region Distribution Graph – Visual Insights for Market Analysis
RJ0700005_17
- Last Update 07/22/2025
- File Size 0.7MB
- # of Slides 2
- File Format PPTX
- Slide Ratio 16:9
- Color
Keywords
- #Content-Based Slides
- #Design-Based Slides
- #Company Introduction
- #Market and Competitor Analysis
- #Graph
- #Other
- #Global Network
- #Target Market
- #Circles
- #Doughnut Chart
- #Map
- #16:9
- #world map PowerPoint slide
- #global map template
- #region distribution diagram
- #target market map
- #pin marker slide
- #global network PowerPoint
- #how to create world map in PowerPoint
About the Product
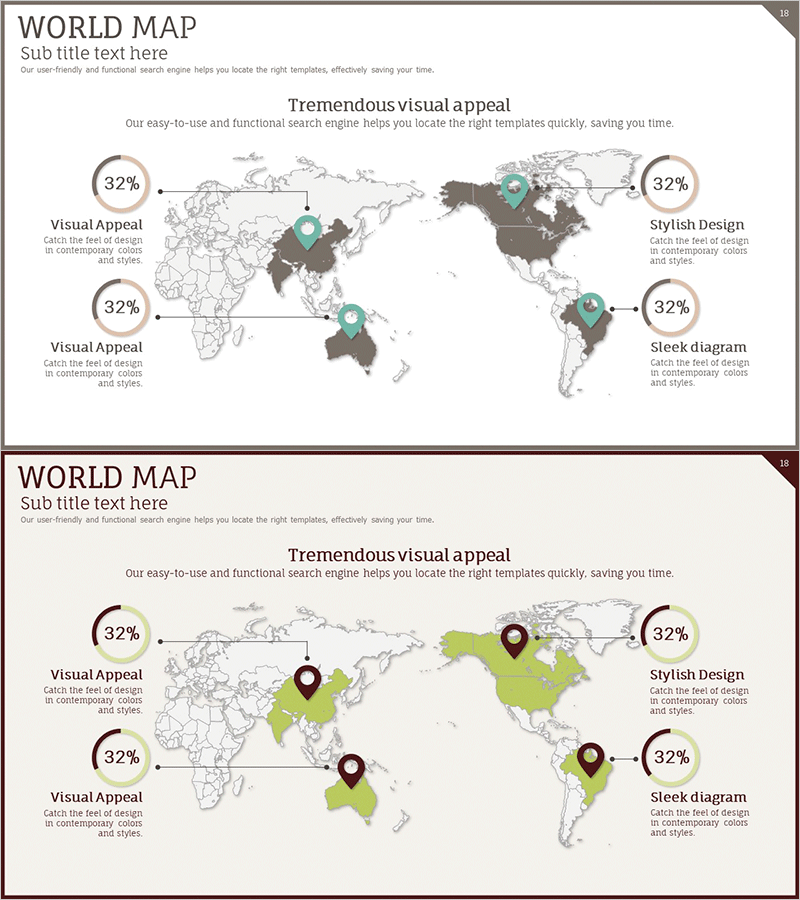
A world map-based PowerPoint slide set designed to visualize global market expansion strategies. The 2-slide deck features the first slide with brown-toned regional emphasis and the second with lime-green-toned regional emphasis, accommodating diverse presentation contexts. Each slide displays 4 regions with pin markers and callout text boxes, enabling clear representation of target markets, sales hubs, and partnership regions. Available in 16:9 widescreen PPTX format for immediate editing. Ideal for market analysis presentations, business expansion reports, and global network introductions.
Usage Points
-
Main Usage
Visualize global market entry strategies, sales hub distribution, and international partnership networks on a world map to convey regional business status intuitively to audiences. Pin markers and text callouts emphasize key information for each region.
-
How to Use
Use slide 1 with brown tones to represent existing markets or primary hubs, and slide 2 with lime-green tones for new market entries or growth regions. Edit pin marker positions and callout text content to reflect actual business data.
-
Recommended For
International business managers, marketing strategy teams, investor pitch presentations, business expansion reports, global sales meetings, and overseas market entry strategy presentations where regional market status needs clear visual explanation.
-
Slide Structure
2-slide composition. Each slide contains a world map background (line style), 4 regional emphasis areas (brown/lime-green fill), 4 pin markers (circular icons), and 4 callout text boxes (percentage figures + descriptive text). 16:9 widescreen format.
Related Products
-

Target Area Status Analysis Graph – Data and Insights
#Company Introduction #Market and Competitor Analysis #Graph
-

Global Food Distribution Map – Insight into the Market
#Company Introduction #Market and Competitor Analysis #Graph
-

Analysis of Key Target Countries Slide - Market and Competitor Analysis
#Company Introduction #Market and Competitor Analysis #Graph
-

Dawn City Theme Global Map
#Company Introduction #Market and Competitor Analysis #Other
