Segmented Bar Graph for Market and Competitor Analysis
RJ0700005_6
- Last Update 07/22/2025
- File Size 0.3MB
- # of Slides 2
- File Format PPTX
- Slide Ratio 16:9
- Color
Keywords
- #Content-Based Slides
- #Design-Based Slides
- #Market and Competitor Analysis
- #Graph
- #Market Analysis
- #Horizontal Bar
- #Segmented Horizontal Bar
- #16:9
- #segmented horizontal bar chart
- #horizontal bar graph PowerPoint
- #market analysis slide
- #competitor comparison chart
- #data visualization template
- #business presentation slide
About the Product
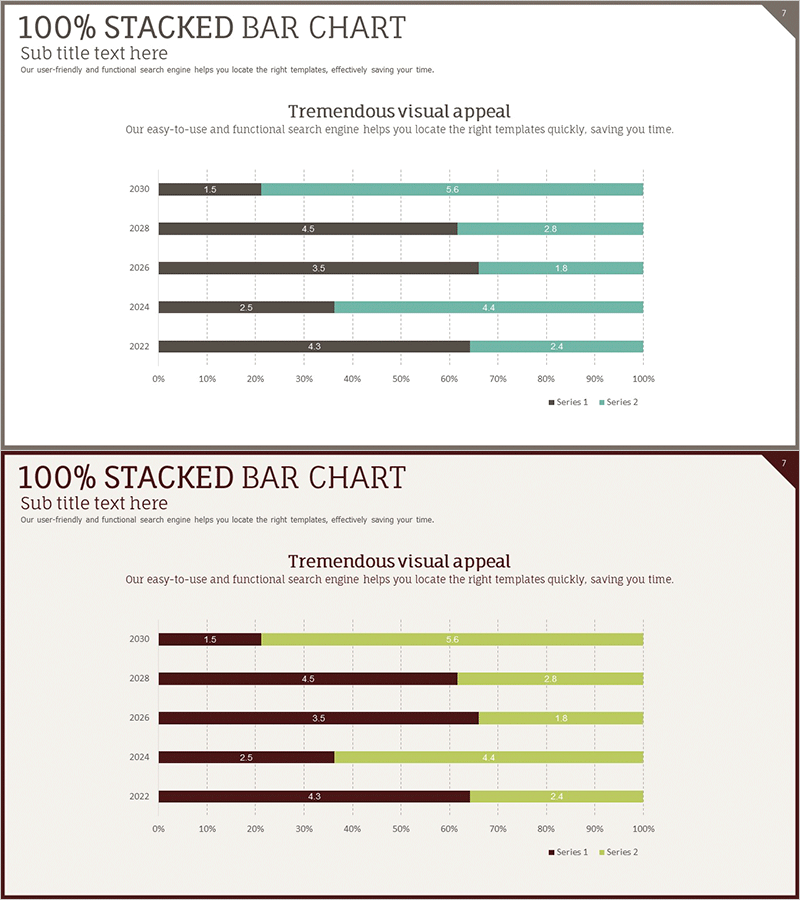
A segmented horizontal bar chart PowerPoint slide optimized for market analysis and competitor comparison. This presentation template displays two data series across five years side-by-side, enabling intuitive trend comparison and performance tracking. The contrasting color palette—dark and light tones—clearly distinguishes between the two series, while gridlines scaled from 0 to 100% facilitate accurate data reading. Fully editable and ready to use in business reports, marketing presentations, investor pitches, and strategic planning decks.
Usage Points
-
Main Usage
Visualize two data series side-by-side across multiple time periods to show market size evolution, competitor performance trends, revenue comparisons, and growth trajectories. The segmented structure simultaneously displays absolute values and relative proportions, supporting data-driven decision-making.
-
How to Use
Insert this slide into executive reports, business plan presentations, marketing strategy meetings, and investor pitches—particularly in competitive landscape or market analysis sections. Replace the legend and data labels with your own figures, adjust colors to match corporate branding guidelines, and the slide is ready for immediate use.
-
Recommended For
Financial analysts, marketing managers, business development professionals, management consultants, and research teams presenting market research findings, sales performance comparisons, customer segment analysis, and competitive benchmarking.
-
Slide Structure
Two-slide set. Slide 1 features a dark-tone color scheme (charcoal and teal) for the two series. Slide 2 offers an alternative palette (burgundy and lime green). Each slide displays five years (2030, 2028, 2026, 2024, 2022) with two horizontal bars per year, including 0–100% gridlines and numerical labels.
Related Products
-

Target Market Analysis Data Table - Market Growth Statistics
#Market and Competitor Analysis #Graph #Other
-

Horizontal Bar Graph Segmentation Blue Yellow – Market Share Analysis
#Market and Competitor Analysis #Graph #Market Share
-

Business Area Analysis Graph & PC Mockup
#Technical Approach #Market and Competitor Analysis #Graph
-

Segmented Bar Graph for Market & Competitor Analysis – Simple Theme
#Market and Competitor Analysis #Graph #Competitor Analysis
