Teacher PPT Wide Template – Modern Design Suitable for Education
J0500010
- Last Update 01/14/2025
- File Size 1.7MB
- # of Slides 35
- File Format PPTX
- Slide Ratio 16:9
- Color
Slide Preview


Keywords
About the Product
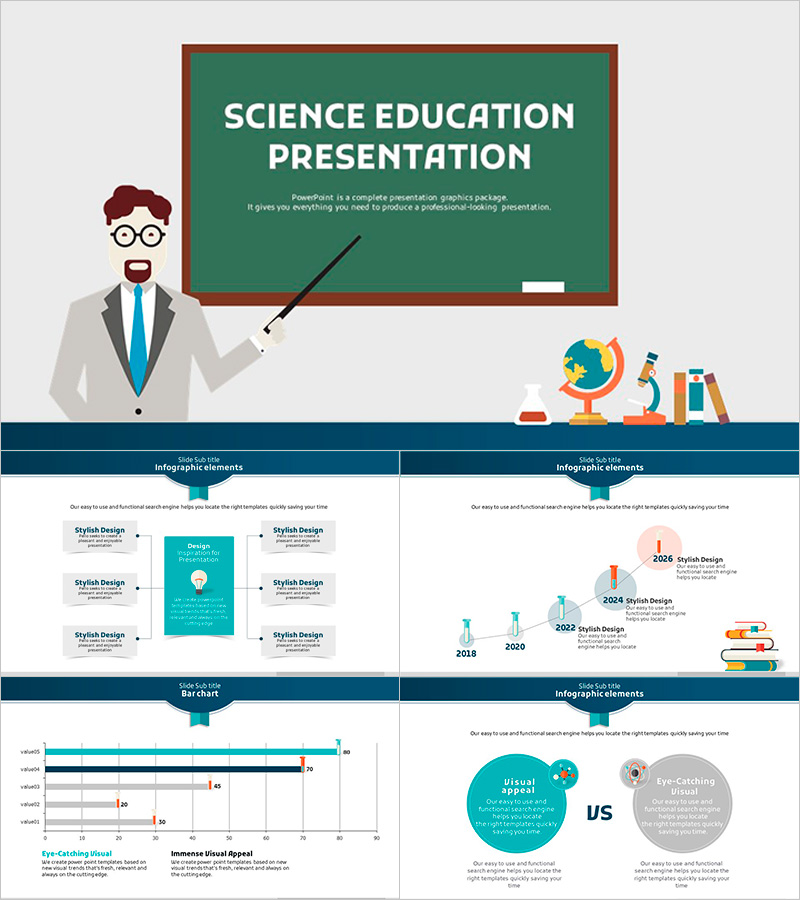
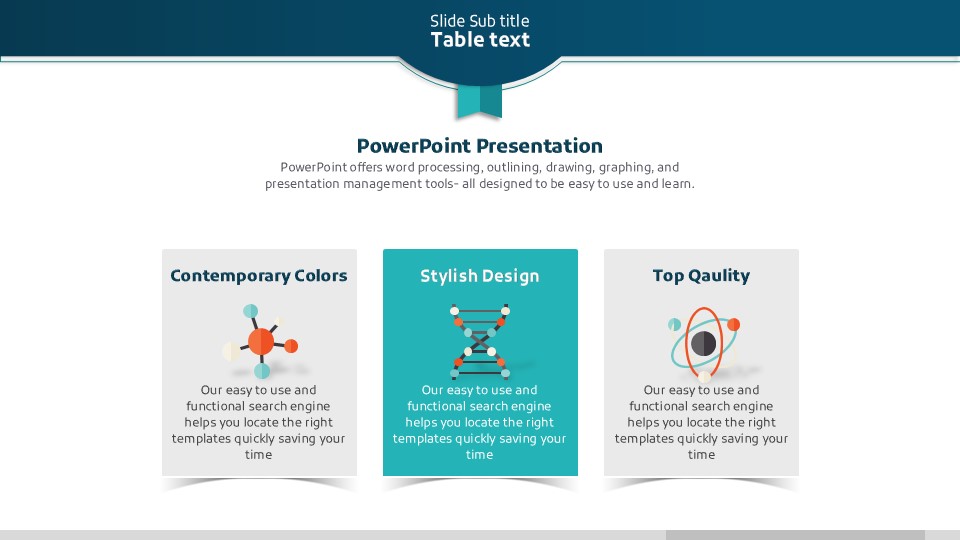
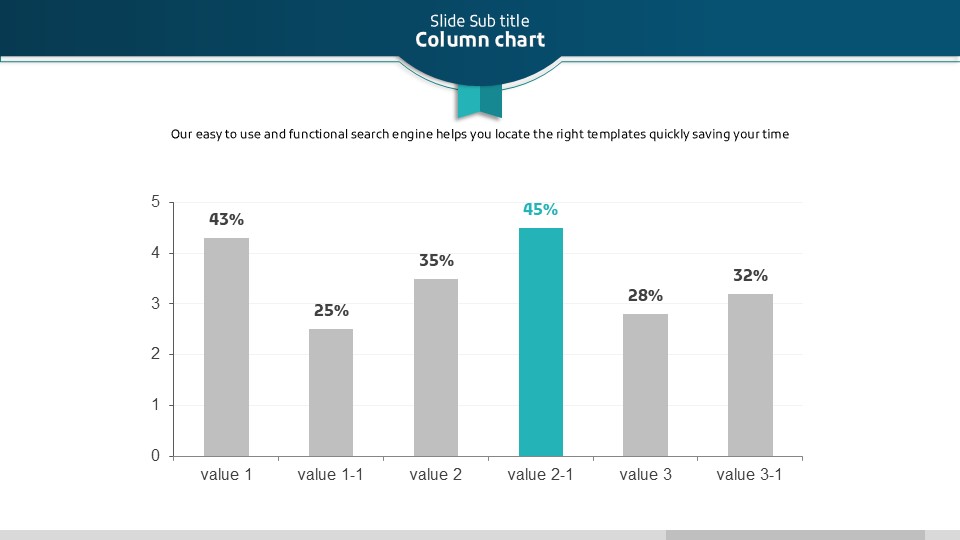
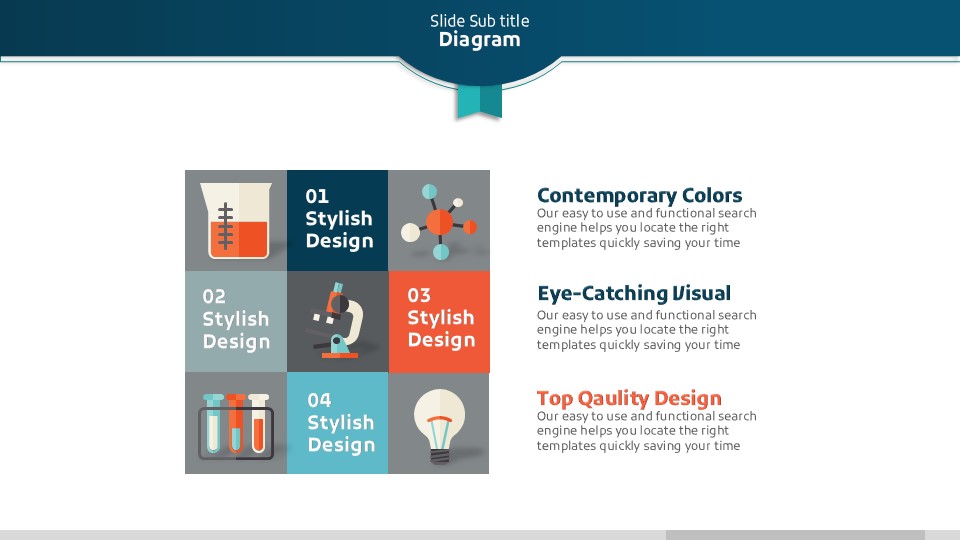
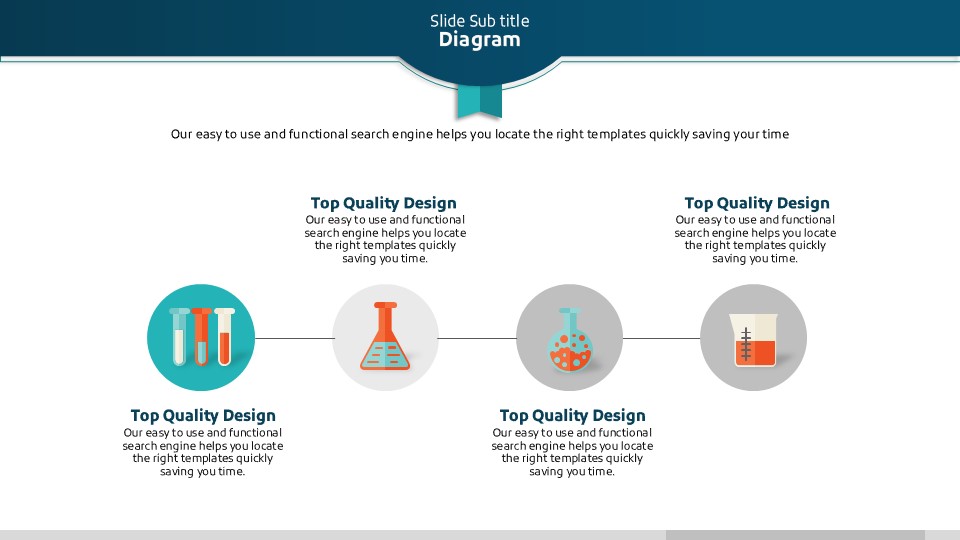
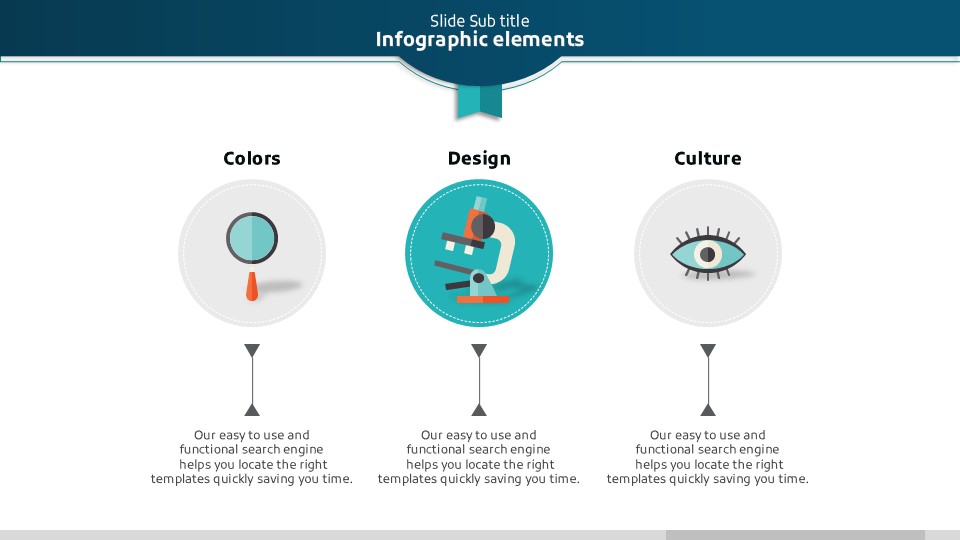
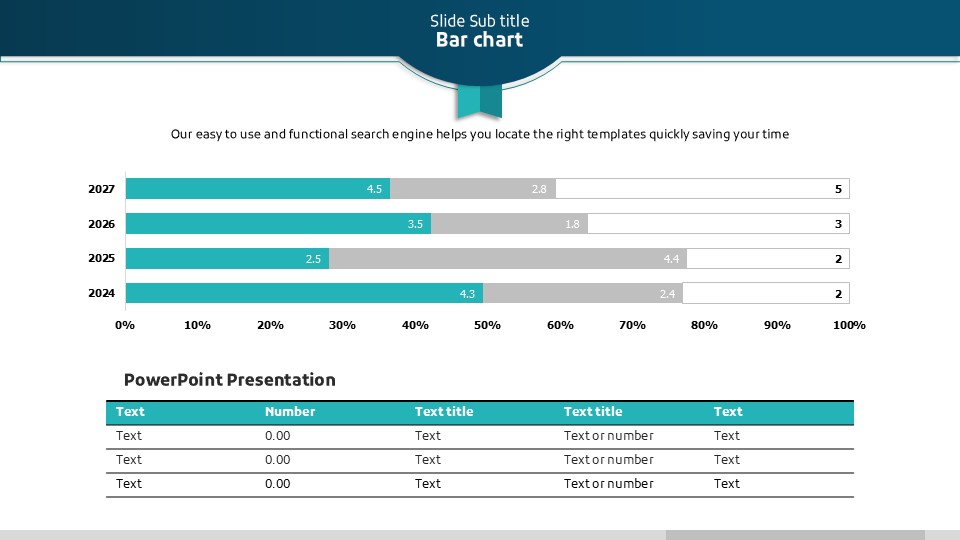
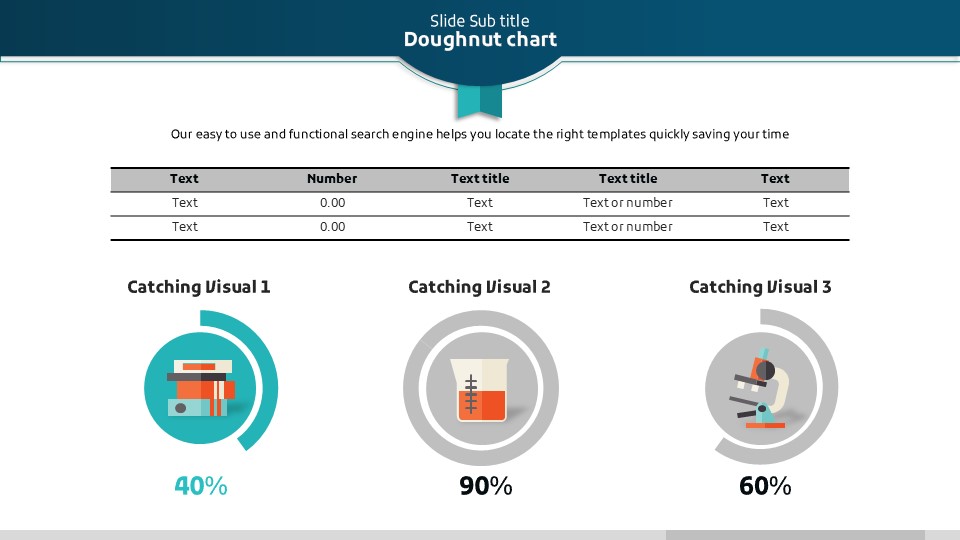
This education-focused PowerPoint template features a flat-illustration teacher character standing at a chalkboard, paired with science icons including a globe, microscope, beaker, and books. The color scheme combines a dark navy header, teal accent color, and light gray background to create a friendly yet professional presentation deck suitable for classrooms, academic seminars, and science lectures. The 35-slide set covers a wide range of slide types: a title slide with teacher illustration, infographic layouts (diagram and timeline styles), horizontal bar charts, vertical column charts, a U.S. regional map with color-coded areas, and VS comparison circle infographics. All slides are provided in 16:9 widescreen PPTX format and are fully editable — text, colors, and layouts can be customized freely to match your content and branding needs.
Usage Points
-
Main Usage
Designed for K-12 teachers, university lecturers, science researchers, and education content creators who need a professional yet approachable presentation template for classroom lessons, academic seminars, or science conference talks.
-
How to Use
Open the PPTX file and replace the placeholder text and data with your own content. Use the bar chart and column chart slides to display research data or student performance metrics, and customize the infographic slides to illustrate concepts or timelines.
-
Recommended For
Recommended for school teachers, education trainers, science and education graduate students, curriculum developers, and school administrators. Ideal for lesson presentations, teacher training sessions, and educational seminar materials.
-
Slide Structure
35 slides total: teacher illustration title slide, flat-icon infographic layouts (diagram and timeline), horizontal bar chart, vertical column chart with teal highlight, U.S. regional color-coded map, and VS comparison circle infographic — covering all key slide types needed for education presentations.
Related Products
-

Creative Presentation Wide – Perfect for Educational and Creative Presentations
#Education
-

Birthday Party Presentation Template – Vibrant Design and Fun
#Education
-

Reading PPT Wide Template – Creative and Educational Design
#Education
-

Animals Illustration Wide PowerPoint – Creative and Fun Design
#Education
