Scientific Areas and Disciplines Diagram - A Visual Tool for Understanding Complexity
RJ0500010_24
- Last Update 06/10/2025
- File Size 0.3MB
- # of Slides 2
- File Format PPTX
- Slide Ratio 16:9
- Color
Keywords
- #Content-Based Slides
- #Design-Based Slides
- #Product/Service Introduction
- #Business Introduction
- #Diagram
- #Composition
- #Business Areas
- #Cluster
- #Chain Diagram
- #16:9
- #radial diagram PowerPoint
- #cluster diagram slide template
- #central hub connection
- #relationship diagram PPT
- #PowerPoint diagram template download
About the Product
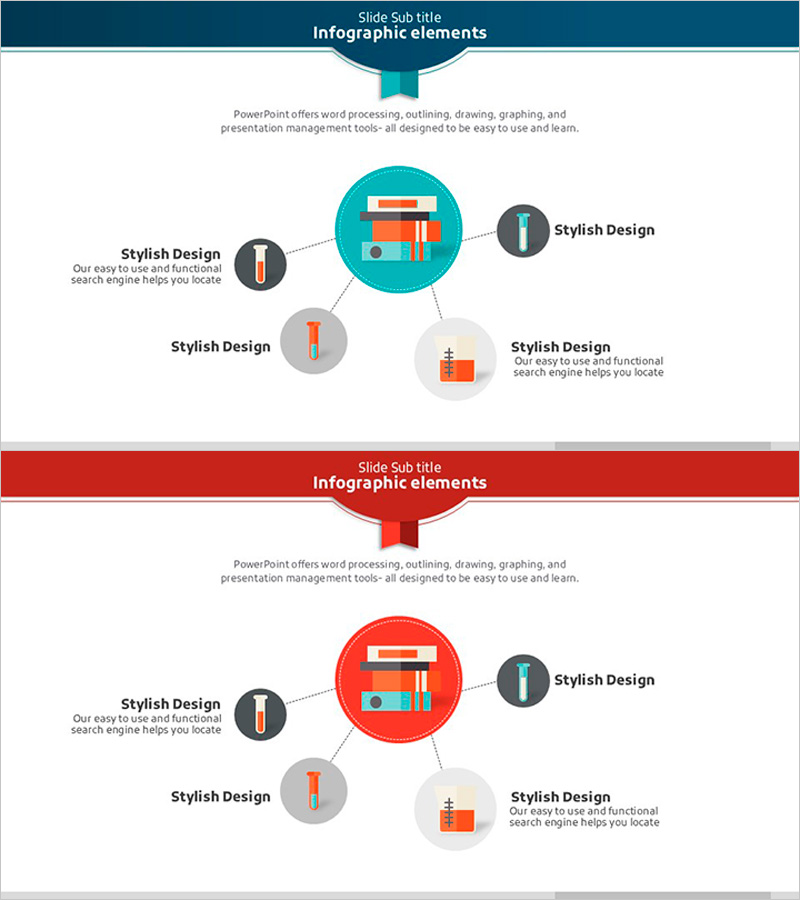
A radial cluster diagram PowerPoint slide that radiates from a central concept to surrounding elements. Features a large turquoise central circular node connected via dotted lines to four peripheral nodes in gray and beige, creating an intuitive visual representation of complex relationships and hierarchies. The 2-slide set includes a turquoise background version and a red background version, with icon and text insertion areas in each node for describing scientific fields, business domains, organizational structures, and more. Instantly applicable to presentations and reports where information hierarchy and relationship visualization are essential.
Usage Points
-
Main Usage
Optimized for explaining complex concepts and organizational structures by radiating from a central idea to surrounding elements. Ideal for scientific field classification, business domain segmentation, organizational hierarchy representation, and core concept decomposition in any presentation requiring information layering.
-
How to Use
Enter the core concept (e.g., science, business, organization name) in the central circular node and add detailed items to the four surrounding nodes. Customize node icons to match your category, adjust colors to fit your presentation theme, and use dotted lines to clearly express relationships between elements.
-
Recommended For
Science and technology presentations, business domain introductions, organizational structure explanations, marketing strategy analysis, educational seminars, consulting reports, research presentations, and any professional context requiring visual relationship mapping across industries and roles.
-
Slide Structure
2-slide set with slide 1 featuring a turquoise background version and slide 2 a red background version. Each slide displays a 5-node radial cluster structure with one large central circular node connected via dotted lines to four surrounding nodes. Each node includes designated areas for icons, titles, and descriptive text.
Related Products
-

Subject Learning Elements Diagram – Visualizing Business Regions and Structure
#Product/Service Introduction #Business Introduction #Diagram
-

Business Structure Diagram – Visualizing Business Areas
#Product/Service Introduction #Business Introduction #Diagram
-

Visualizing Business Activities – Innovative Components
#Product/Service Introduction #Business Introduction #Diagram
-

Chemical Element Diagram – Visual Representation of Composition
#Product/Service Introduction #Business Introduction #Diagram
