Market Analysis and Financial Performance Visualization with Horizontal Bar Chart and Table
RJ0500010_25
- Last Update 06/10/2025
- File Size 0.3MB
- # of Slides 2
- File Format PPTX
- Slide Ratio 16:9
- Color
Keywords
- #Content-Based Slides
- #Design-Based Slides
- #Market and Competitor Analysis
- #Financial Plans and Performance
- #Diagram
- #Graph
- #Market Analysis
- #Budget
- #Table
- #Horizontal Bar
- #Standard Table
- #Segmented Horizontal Bar
- #16:9
- #horizontal bar chart PowerPoint
- #bar graph slide template
- #data visualization presentation
- #financial analysis PPT
- #market comparison slide
- #business data chart download
About the Product
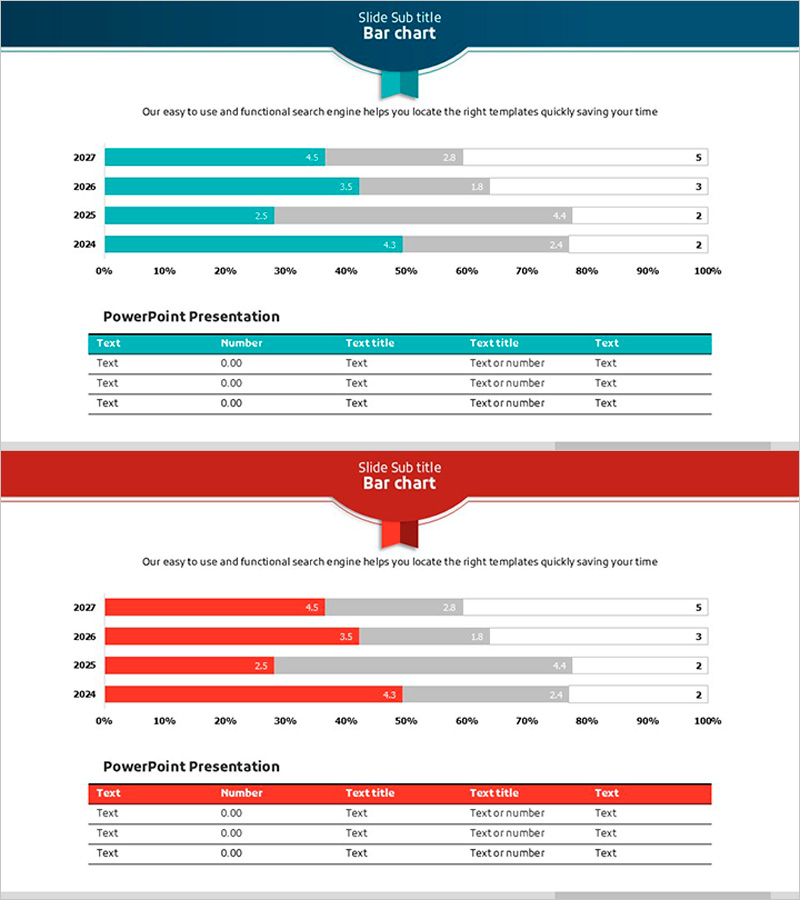
A professional PowerPoint slide featuring horizontal bar charts and data tables for comparing market analysis and financial performance across four years (2024–2027). The design uses teal and red color schemes to distinguish between two data series, with clearly labeled values and percentages for each year. The accompanying data table below the chart allows for easy input of detailed figures, making it ideal for business reports, financial presentations, and market analysis decks. This 16:9 widescreen template consists of 2 fully editable slides where colors, values, and labels can be customized to match your specific data.
Usage Points
-
Main Usage
This slide template enables year-over-year and item-by-item numerical comparisons using horizontal bar charts, supplemented by detailed data tables for comprehensive information presentation. It is optimized for quantitative data presentations such as market size comparisons, revenue trends, cost-benefit analysis, and performance metrics.
-
How to Use
Slide 1 displays a teal bar chart while Slide 2 shows a red version, allowing you to present contrasting scenarios or comparative data. Double-click the chart values and labels to replace them with your actual data. Update the table cells with specific figures, and adjust colors as needed using PowerPoint's built-in formatting tools.
-
Recommended For
Finance teams presenting quarterly and annual performance reports, marketing departments analyzing market share and competitive positioning, executive presentations on business results, investor relations meetings, and consulting firms preparing client analysis documents.
-
Slide Structure
Slide 1: Teal horizontal bars (4 bars for years 2027–2024) with gray comparison bars and numerical labels; 5-column data table below (Text, Number, Text title, Text title, Text). Slide 2: Identical layout in red. Both slides include a title header and descriptive text area at the top.
Related Products
-

Red Ratio Horizontal Bar Graph – Market Analysis and Trends
#Market and Competitor Analysis #Diagram #Graph
-

Chemical Experiment Analysis Graph Chart – Visualizing R&D Achievements
#Technical Approach #Market and Competitor Analysis #Diagram
-

Simple & Modern Wide PPT Mockup for Business Insights
#Market and Competitor Analysis #Financial Plans and Performance #Diagram
-

Graph Charts for Systematic Market Analysis – Bar and Pie Charts
#Technical Approach #Market and Competitor Analysis #Diagram
