Chemistry and Biotechnology Donut Chart – Market Share Analysis
RJ0500010_28
- Last Update 06/10/2025
- File Size 0.4MB
- # of Slides 2
- File Format PPTX
- Slide Ratio 16:9
- Color
Keywords
- #Content-Based Slides
- #Design-Based Slides
- #Market and Competitor Analysis
- #Graph
- #Market Share
- #Circles
- #Doughnut Chart
- #16:9
- #donut chart PowerPoint slide
- #pie chart template
- #ratio visualization PowerPoint
- #circular graph slide design
- #data visualization template
- #how to create donut chart in PowerPoint
About the Product
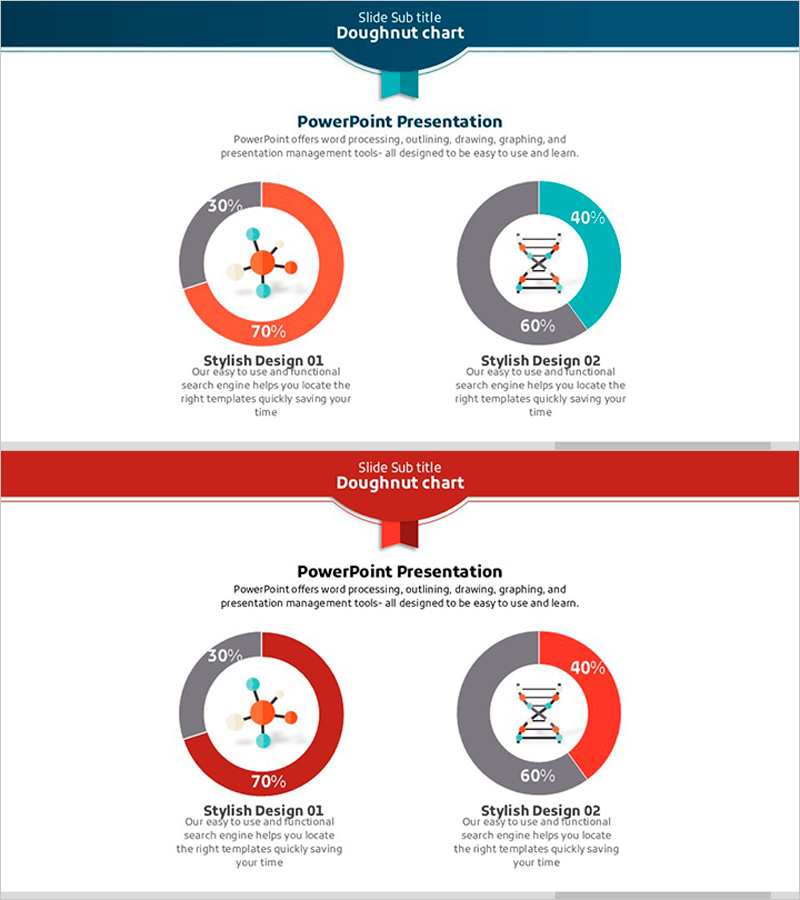
A 2-slide donut chart PowerPoint template featuring dual circular graphs with teal, gray, and coral color schemes. Each slide displays two donut charts side-by-side, enabling direct comparison of different data sets and their proportional composition. The center of each donut includes space for icons or symbols to represent the data category, while descriptive text boxes below provide context and interpretation. The design supports multi-series data visualization with clear percentage labels and color-coded segments. Ideal for presenting market share analysis, revenue distribution, component breakdown, customer satisfaction metrics, and budget allocation across business presentations and reports.
Usage Points
-
Main Usage
Visualize proportional data such as market share, revenue distribution, budget allocation, customer satisfaction scores, and component composition. The dual-chart layout enables side-by-side comparison of two related datasets, making it ideal for trend analysis and competitive benchmarking.
-
How to Use
Replace the percentage values and segment labels with your own data. Insert relevant icons or images in the center area to reinforce the data category. Update the descriptive text boxes below each chart to provide context and interpretation for your audience.
-
Recommended For
Marketing professionals, financial analysts, business executives, management consultants, and data analysts. Suitable for quarterly business reviews, investor presentations, market analysis reports, and industry benchmarking studies in chemistry, biotechnology, pharmaceuticals, consumer goods, and finance sectors.
-
Slide Structure
2 slides total. Each slide contains 2 donut charts arranged in a 2-column layout. Each chart displays 2-3 color-coded segments with percentage labels. Center icon insertion area and bottom text boxes for titles and descriptions. 16:9 widescreen format in PPTX.
Related Products
-

Soccer Match Analysis Chart – Performance Analysis and Future Forecast
#Business Vision and Strategy #Market and Competitor Analysis #Graph
-

Visualizing Market Share with Watercolor Donut Chart
#Market and Competitor Analysis #Graph #Market Share
-

Travel Guide Business Goal Market Strategy Donut Chart – Market Share Analysis
#Market and Competitor Analysis #Marketing Plan and Strategy #Graph
-

Doughnut Chart for Office Worker Commuting Survey Results – Market Trends Visualization
#Market and Competitor Analysis #Graph #Market Status
