Science Icons and Scheme Diagrams – Visualizing Business Strategies
RJ0500010_22
- Last Update 06/10/2025
- File Size 0.4MB
- # of Slides 2
- File Format PPTX
- Slide Ratio 16:9
- Color
Keywords
About the Product
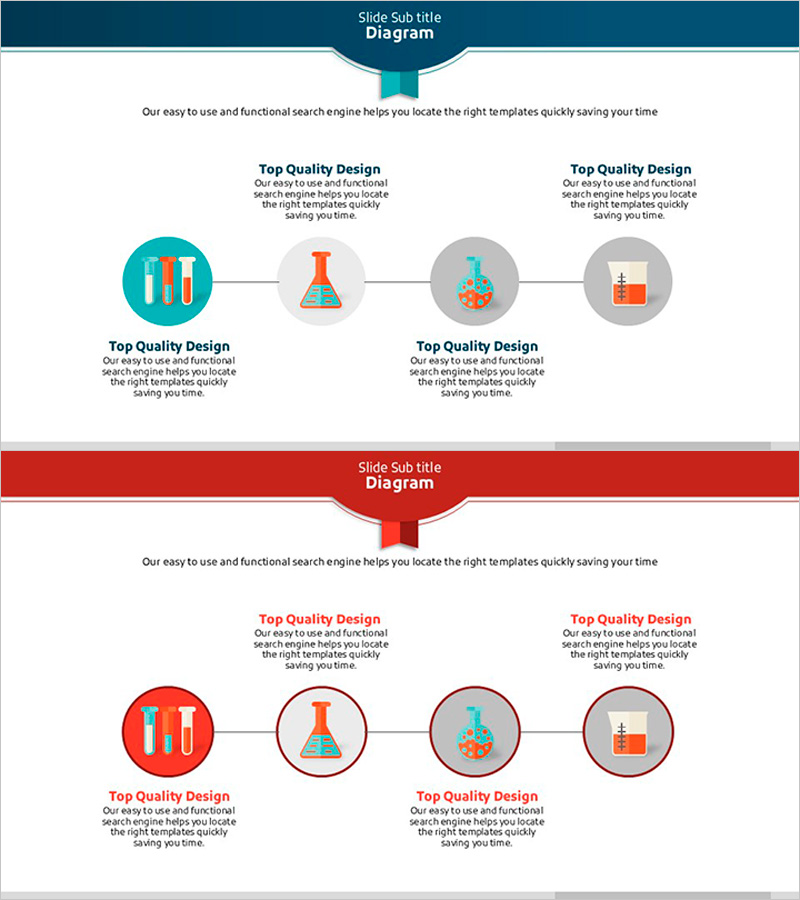
A 4-stage linear flow diagram PowerPoint slide designed to visualize business strategy and execution plans. Features science-themed icons (bar chart, triangular flask, molecular structure, chemical apparatus) to emphasize each stage of the process. Available in two color versions: teal and red, with circular nodes connected by flow lines for clear process visualization. The 16:9 widescreen format includes 2 slides with balanced text areas and icon placement, ready for immediate use in presentations, business plans, and strategic reports.
Usage Points
-
Main Usage
Visualize business execution strategies, product development roadmaps, and process workflows in four clear stages. Science icons reinforce innovation and analytical approach, allowing you to explain stage-specific objectives and action items systematically to your audience.
-
How to Use
Enter stage titles and descriptions in each circular node. Icons can be customized to match each stage's characteristics, and background colors (teal or red) can be selected to align with your presentation theme. Connection lines and arrows emphasize the sequential relationship between stages.
-
Recommended For
Ideal for strategy planners, R&D teams, project managers, and marketing professionals presenting business plans, technology roadmaps, and campaign phases. Effective for executive briefings, investor presentations, and internal training materials.
-
Slide Structure
2-slide layout with header section (dark teal or red background) and content area. Four circular nodes arranged horizontally from left to right, each containing a science icon and text input field. Connection lines and directional arrows link nodes to show linear progression.
Related Products
-

Mobile Video Viewing App System – Business Strategy Diagram
#Business Strategy #Diagram #Production Plan
-

Flow Diagram by Meat Type – Emphasizing Business Strategy
#Business Strategy #Diagram #Production Plan
-

Project Facility System Diagram – Efficient Operation Planning
#Business Strategy #Operational Plan #Diagram
-

Military Supplies and Flow Diagrams – Business Strategy
#Business Strategy #Diagram #Implementation Framework
