Test Tube Bar Graph for Market Analysis – Highlighting Competitive Advantage
RJ0500010_6
- Last Update 06/10/2025
- File Size 0.3MB
- # of Slides 2
- File Format PPTX
- Slide Ratio 16:9
- Color
Keywords
- #Content-Based Slides
- #Design-Based Slides
- #Market and Competitor Analysis
- #Graph
- #Market Status
- #Competitive Advantage
- #Horizontal Bar
- #Horizontal Bar Chart
- #16:9
- #horizontal bar chart PowerPoint
- #bar graph slide template
- #market analysis chart
- #competitor comparison graph
- #data visualization PowerPoint slide
About the Product
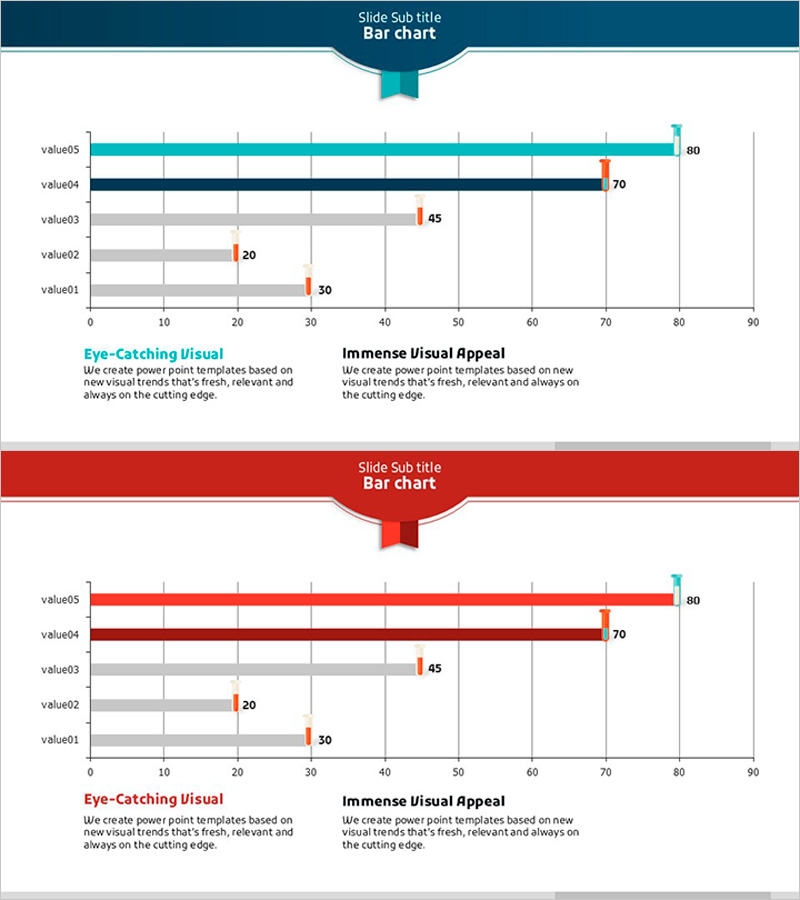
A horizontal bar chart PowerPoint slide designed for market analysis and competitive advantage visualization. This presentation template features five data items (value01 through value05) displayed in a teal and red dual-color scheme for maximum contrast and visual impact. Each bar is scaled from 0 to 90 with clearly labeled data values on the right side. The slide header includes two messaging zones—'Eye-Catching Visual' and 'Immense Visual Appeal'—allowing you to emphasize key presentation points. The two-slide set provides multiple color variations and is optimized for 16:9 widescreen format, making it ideal for business reports and competitive analysis presentations.
Usage Points
-
Main Usage
Visualize market conditions, competitor benchmarking, and performance metrics by comparing five data items side-by-side. The teal-highlighted bar draws attention to your company's competitive advantage, making relative sizes and rankings immediately clear to your audience.
-
How to Use
Insert this slide into business reports, marketing plans, and investor pitch decks in the market analysis section. Edit the bar lengths and colors to reflect your actual data, then customize the header messaging area with your analysis conclusions or key takeaways.
-
Recommended For
Marketing managers, business strategists, and executives presenting market conditions and competitive positioning. Ideal for strategic planning meetings, executive briefings, and client proposal presentations where quantitative comparison is essential.
-
Slide Structure
Two-slide set. Each slide features a dark blue header with ribbon badge, five horizontal bars in teal, dark navy, gray, gray, and orange tones, right-aligned numeric labels (0–90 scale), and a dual-message footer area for 'Eye-Catching Visual' and 'Immense Visual Appeal' callouts.
Related Products
-

Meat and Vegetable Consumption by Region – Market Status Analysis
#Market and Competitor Analysis #Graph #Other
-

India Travel-Related Business Overview and Market Share – Market Status Analysis
#Market and Competitor Analysis #Graph #Market Status
-

Market Analysis Visualization with Horizontal Bar Chart – Emphasizing Competitive Advantage
#Market and Competitor Analysis #Graph #Market Status
-

Eco Market Analysis Graph – Visualizing Competitive Advantage Data
#Market and Competitor Analysis #Graph #Market Status
