Genetic Prototype Infographic – Optimized for Operations and Technology Development
RJ0500010_33
- Last Update 06/10/2025
- File Size 0.4MB
- # of Slides 2
- File Format PPTX
- Slide Ratio 16:9
- Color
Keywords
- #Content-Based Slides
- #Design-Based Slides
- #Operational Plan
- #Technical Approach
- #Diagram
- #Production and Technology Development Strategy
- #System Architecture Diagram
- #Spread
- #Radial Diagram
- #16:9
- #radial diagram PowerPoint
- #infographic slide template
- #central hub structure diagram
- #system architecture PPT
- #technology development presentation slide
About the Product
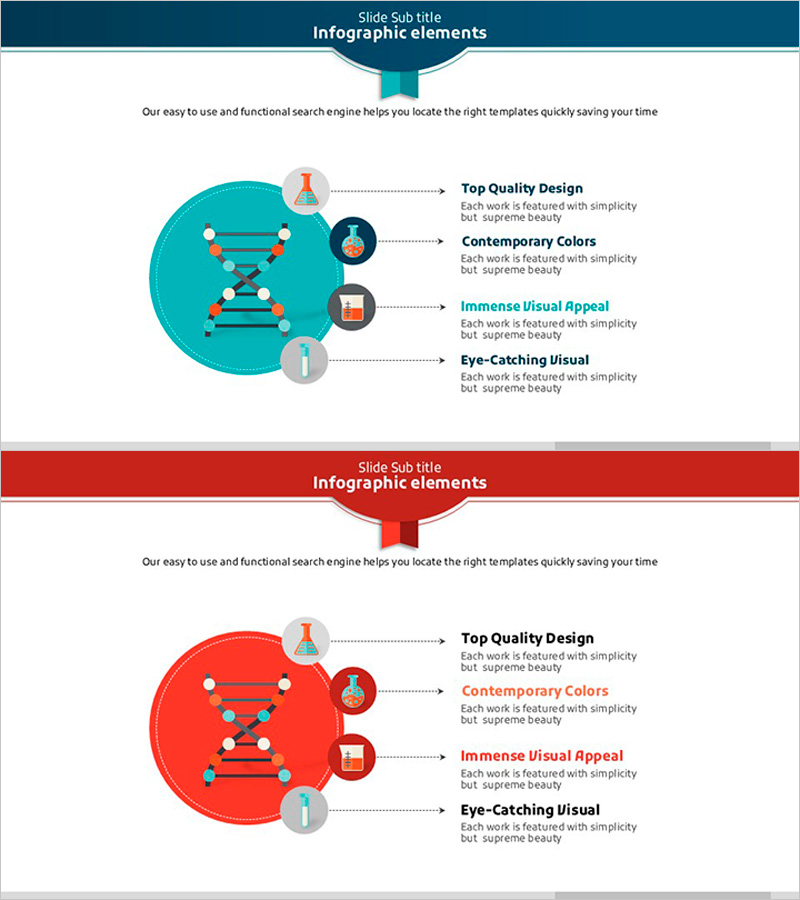
A radial diagram PowerPoint slide featuring a central circular node with four branches extending outward in cardinal directions. Available in two color schemes—turquoise and red—with icons and descriptive text positioned at each outer node. Ideal for visualizing operational strategies, technology development frameworks, system architecture, and process flows where a core concept radiates to peripheral elements. Dotted connector lines and circular backgrounds establish clear visual hierarchy. Ready to use in presentations, planning documents, and business reports.
Usage Points
-
Main Usage
Visualizes core organizational concepts or strategies radiating from a central hub to peripheral elements. Perfect for representing four strategic pillars, key technology components, central server architecture with connected modules, or multi-faceted operational plans. Draws audience focus to the center, then naturally guides attention to supporting details.
-
How to Use
Enter your core topic in the central circular node and place supporting elements in the four outer nodes. Customize icons to match your content and add descriptive text to each section. Use the turquoise version for technology and innovation topics; apply the red version for strategy and performance themes. The two-slide format enables comparative analysis or temporal progression visualization.
-
Recommended For
Technology directors, development team leads, operations managers, strategic planners, and project managers explaining technology roadmaps, system configurations, or operational strategies. Effective for technical seminars, internal reports, investor presentations, and product development briefings where complex structures require intuitive visual communication.
-
Slide Structure
Two-slide set. Each slide contains one central circular node, four outer circular nodes, dotted connector lines, four icons, and four text boxes. In 16:9 widescreen format, the central node anchors the left-center position while four outer nodes occupy top, top-right, bottom-right, and bottom-left positions, creating a balanced radial configuration.
Related Products
-

Business System Architecture Diagram – Perfect Visualization for Technical Sections
#Operational Plan #Technical Approach #Diagram
-

Renewable Energy Production and Technology Development Strategy Icon
#Operational Plan #Technical Approach #Diagram
-

Strategic Framework of Tech Communication – Innovative Communication Template
#Operational Plan #Technical Approach #Diagram
-

Visualize Business Plans with Automotive Wide Template – Innovation and Growth
#Product/Service Introduction #Operational Plan #Diagram
