Advances in Science by Year Slide
RJ0500010_30
- Last Update 06/10/2025
- File Size 0.4MB
- # of Slides 2
- File Format PPTX
- Slide Ratio 16:9
- Color
Keywords
- #Content-Based Slides
- #Design-Based Slides
- #Technical Approach
- #Diagram
- #Future Development Roadmap
- #Innovative Technologies and Future Plans
- #Flow
- #Linear Flow
- #16:9
- #timeline diagram PowerPoint
- #science development slide
- #linear flow diagram
- #technology advancement presentation
- #milestone timeline slide template
About the Product
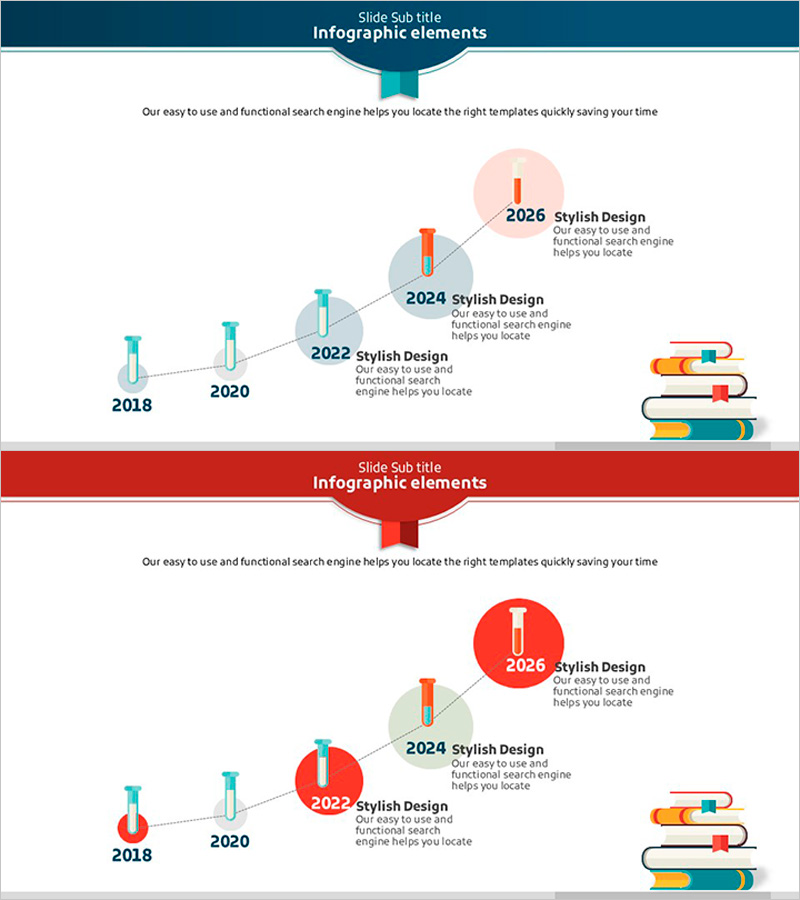
A linear timeline PowerPoint slide that visualizes the progression of scientific and technological advancement from 2018 to 2026 in chronological order. Each year milestone is represented as a circular node connected by vertical lines, with descriptive text and icons positioned at each stage for clear information delivery. The design uses a dark blue header with accent colors in peach pink, light gray, and orange nodes to establish visual hierarchy, while a stack of books illustration on the right reinforces the message of learning and growth. Formatted in 16:9 widescreen with 2 slides, this presentation resource is ready for immediate use in technology advancement, future planning, and innovation strategy presentations.
Usage Points
-
Main Usage
Ideal for expressing technological development processes, research project phases, product development roadmaps, and organizational growth trajectories in chronological order. This slide enables scientists, technologists, educators, and R&D professionals to intuitively communicate annual achievements and future plans to audiences.
-
How to Use
Replace the text and descriptions at each year node with your project milestones. Colors can be retained or changed to match corporate branding, and nodes can be added or removed to accommodate different time periods. The right-side illustration can be replaced with industry-specific icons to create a more customized presentation.
-
Recommended For
Scientists, researchers, technology managers, educators, planners, and marketing professionals presenting technological innovation, research outcomes, product roadmaps, and organizational development. Suitable for academic presentations, technology seminars, corporate strategy meetings, and educational presentations requiring credible information delivery.
-
Slide Structure
2-slide set with the first slide featuring a dark blue header titled 'Infographic elements' and the second in red header version. Each slide displays 4 year nodes (2018, 2020, 2022, 2024, 2026) connected horizontally by dotted lines, with circular badges and descriptive text positioned above each node in a linear timeline structure. Three book stack icons arranged vertically on the right reinforce the learning and growth message.
Related Products
-

Business Strategy Flow System – Innovation and Growth
#Technical Approach #Diagram #Future Development Roadmap
-

Embedded Diagram for Detailed View of Flora and Fauna – Innovative Technology and Future Developments
#Technical Approach #Diagram #Future Development Roadmap
-

Eco-farming Agriculture Future Development Direction Arrow – Flow of Innovation
#Technical Approach #Diagram #Text Box
-

Dark AI 2-Step Flow Slide – 6-Card Feature Grid PowerPoint
#Technical Approach #Diagram #Future Development Roadmap
