Light Bulb Science Donut Chart – Clarity in Information Delivery
RJ0500010_12
- Last Update 06/09/2025
- File Size 0.4MB
- # of Slides 2
- File Format PPTX
- Slide Ratio 16:9
- Color
Keywords
- #Content-Based Slides
- #Design-Based Slides
- #Product/Service Introduction
- #Technical Approach
- #Graph
- #Development Status
- #Research and Development
- #Circles
- #Doughnut Chart
- #16:9
- #donut chart PowerPoint slide
- #pie chart template
- #data ratio visualization
- #two-color chart design
- #how to create donut chart in PowerPoint
About the Product
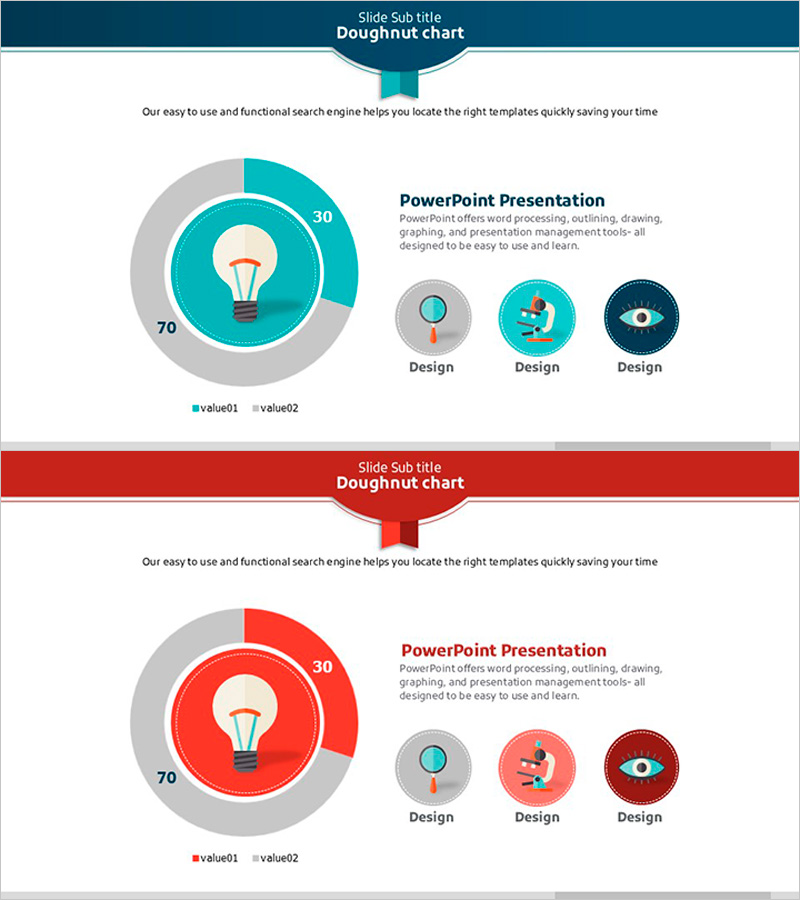
A donut chart PowerPoint slide featuring a light bulb icon at the center, designed to visualize two data series with clarity and impact. The teal and gray color scheme creates strong visual contrast, making data ratios immediately comprehensible. This 16:9 widescreen template includes 2 fully editable slides ready for instant use in presentations. The donut chart format allows you to place a key message or icon in the center space, making it ideal for technology, science, and data-driven presentations. All shapes and text fields are customizable, enabling you to update values and labels to match your specific data.
Usage Points
-
Main Usage
Displays the relationship between two data series as proportional segments within a circular format. The center icon space emphasizes the topic, while legends and numerical labels ensure clear information delivery and audience comprehension.
-
How to Use
Insert this slide into technology presentations, scientific seminars, or data analysis reports where you need to show key performance metrics. Replace the center light bulb icon with your own image or text to match your topic. Edit colors and values to reflect your actual data.
-
Recommended For
Technology professionals, data scientists, research analysts, and IT marketing teams creating data-driven presentations. Ideal for comparing product performance metrics, market share distribution, technology stack composition, or any scenario requiring two-item ratio comparison.
-
Slide Structure
Each slide features a header section with title and subtitle, and a main content area. The donut chart displays a light bulb icon in the center, with inner ring showing 30 (teal) and outer ring showing 70 (gray). Three icon elements are positioned on the right side. Both slides maintain consistent layout for cohesive presentation flow.
Related Products
-

Blue Pink Circle Graph & Table Chart – Slide Highlighting Visual Appeal
#Product/Service Introduction #Operational Plan #Technical Approach
-

Donut Chart of Pharmaceutical Ingredient Composition
#Product/Service Introduction #Technical Approach #Graph
-

Science Experiment Analysis Circle Graph Table Chart – Technological Advancement
#Product/Service Introduction #Technical Approach #Diagram
-

Donut Chart for Comparing Research Analysis Results
#Product/Service Introduction #Technical Approach #Graph
