Magnetic Pie Chart – Market Share Analysis
RJ0500010_29
- Last Update 06/10/2025
- File Size 0.4MB
- # of Slides 2
- File Format PPTX
- Slide Ratio 16:9
- Color
Keywords
About the Product
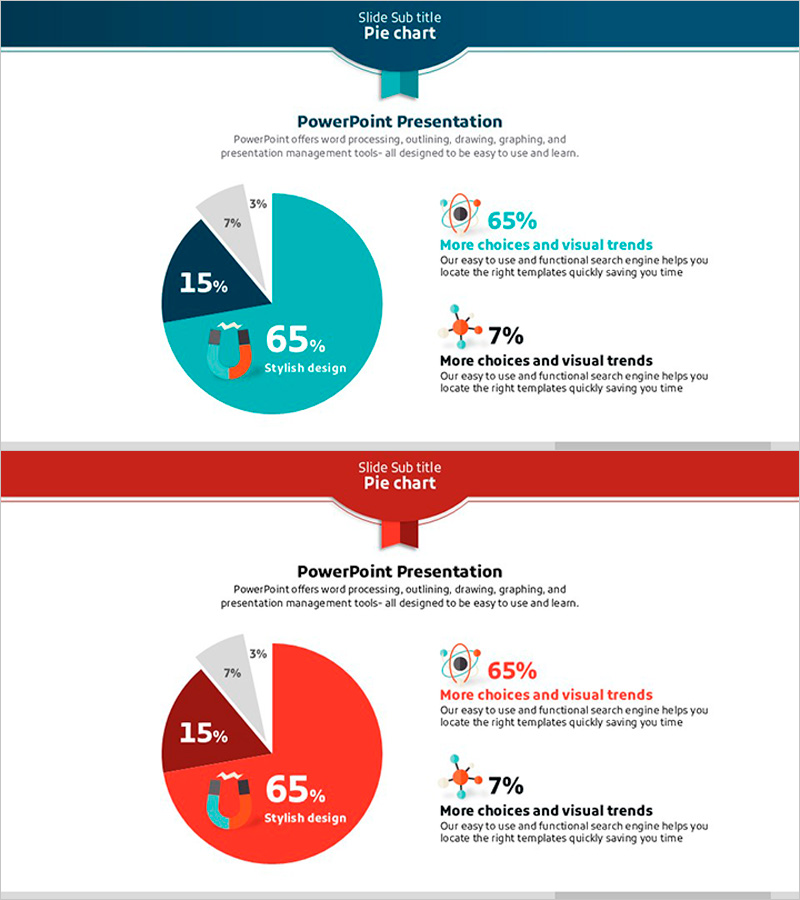
A 4-segment pie chart PowerPoint slide designed for market share and competitive analysis. The circular chart is displayed with a magnetic separation effect against a teal and navy blue dual-tone background, with numerical data and descriptive text positioned on the right side for easy interpretation. The template includes two slides with identical layouts in different color schemes—teal and red versions—allowing you to select the appropriate color for your presentation context. Fully editable in PowerPoint with 16:9 widescreen aspect ratio.
Usage Points
-
Main Usage
Clearly visualizes market share, sales ratios, customer composition, and budget allocation by showing each segment's proportion of the whole. The magnetic separation effect emphasizes individual segments while maintaining a clear view of the overall composition.
-
How to Use
Use in executive reports, business plans, and marketing strategy presentations within the market analysis section. Input numerical values and segment labels into each pie slice, and add analysis and insights in the right-side text boxes. Select between the teal and red versions based on your presentation theme and context.
-
Recommended For
Marketing managers, executives, business analysts, and consultants explaining market conditions and competitive landscape. Ideal for quarterly performance reports, new business proposals, and investor pitch decks that require data-driven decision support.
-
Slide Structure
4-segment pie chart (65%, 15%, 7%, 3% sample data) with magnetic separation effect + right-aligned numerical and descriptive text boxes (2 boxes). One teal-background slide + one red-background slide, total 2 slides.
Related Products
-

Pie Chart of the Development Status of the Snow Mountain Theme
#Product/Service Introduction #Market and Competitor Analysis #Diagram
-

Carbon Neutral Customer Survey Pie Chart
#Market and Competitor Analysis #Graph #Market Status
-

Market Share Analysis Graph & Table – Enhancing Understanding through Data Visualization
#Product/Service Introduction #Market and Competitor Analysis #Diagram
-

Chart Analysis of Aerobic Exercise – Market Share Visualization
#Market and Competitor Analysis #Diagram #Graph
