Competitive Advantage Bar General Graph – Emphasizing Performance through Market Analysis
RJ0500010_10
- Last Update 06/09/2025
- File Size 0.3MB
- # of Slides 2
- File Format PPTX
- Slide Ratio 16:9
- Color
Keywords
About the Product
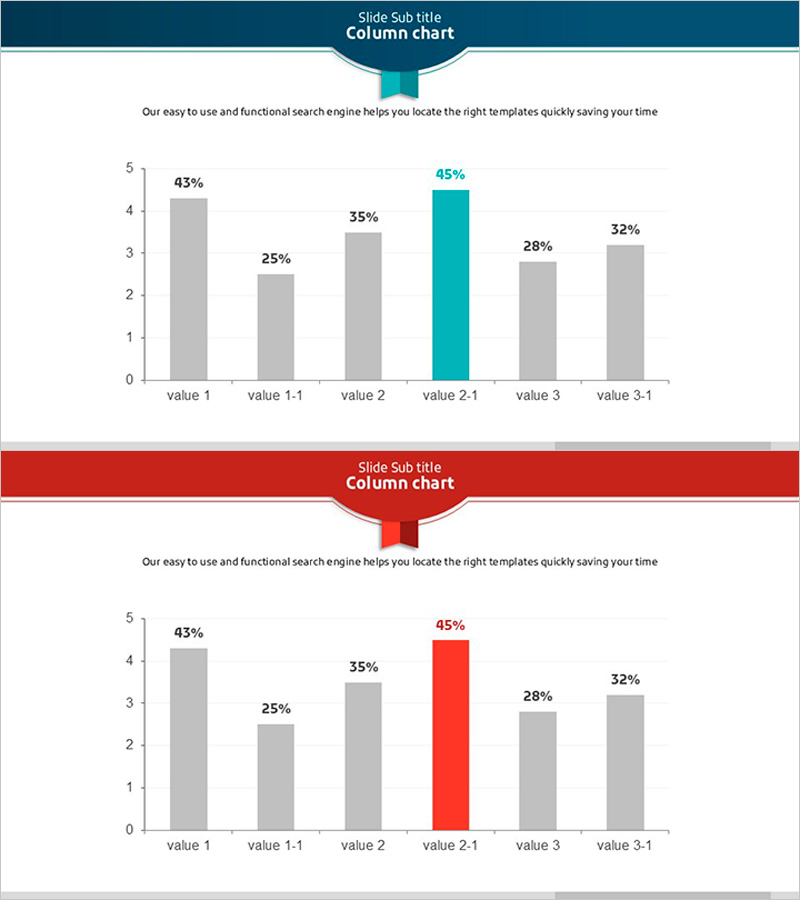
This free column chart slide is designed to highlight competitive advantage and market analysis with 6 comparable data points. One bar is emphasized in teal or red to draw attention to key performance metrics. Simply replace the text and values with your own data, and this PowerPoint slide is ready to use in business plans, reports, proposals, and presentations. The dark header design adds professionalism, and the straightforward layout saves editing time. Discover more chart variations and graph slide templates at GoodPello.
Usage Points
-
Main Usage
Visualize and compare 6 quantitative data points using vertical bars, with one item highlighted to emphasize competitive advantage, market share, or performance metrics.
-
How to Use
Replace the existing labels and percentage values with your own data. Select the color for the emphasized bar to highlight your key performance indicator. Insert into any business presentation, report, proposal, or investor pitch deck.
-
Recommended For
Executives, business analysts, marketing professionals, and anyone presenting quantitative comparisons in board meetings, investor presentations, quarterly reviews, or strategic planning sessions.
-
Slide Structure
Single-slide design with title and description at top, 6-item vertical bar chart in center, and legend at bottom. Dark header with ribbon accent provides professional appearance; one accent color emphasizes the key data point.
Related Products
-

Bar Chart of Decline & Rise Analysis – Emphasizing Market Competitiveness
#Free Graphs
-

Data Visualization with Bar Charts – Presentation for Efficient Choices
#Free Graphs
-

Competitor Analysis and Market Trend Graph – Blue, Orange, Green Colors
#Free Graphs
-

Comparative Analysis Bar Graph – Market and Competitor Analysis
#Free Graphs
