Natural Resources Presentation Template – Eco-Friendly Design
J0600029
- Last Update 12/20/2024
- File Size 2MB
- # of Slides 35
- File Format PPTX
- Slide Ratio 16:9
- Color
Slide Preview


Keywords
About the Product
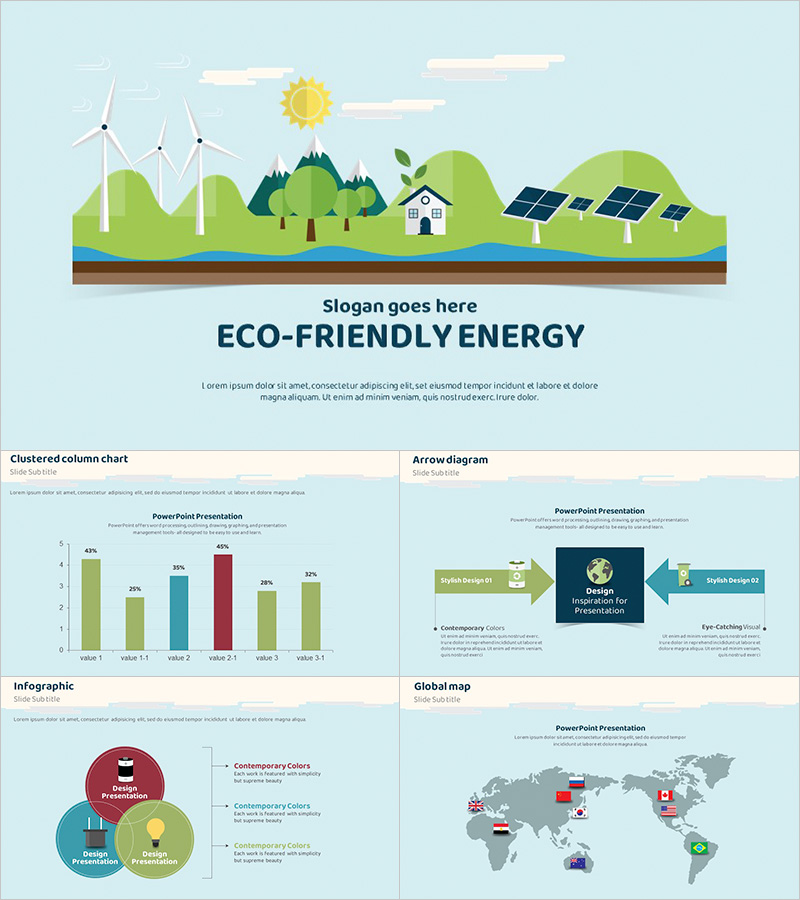
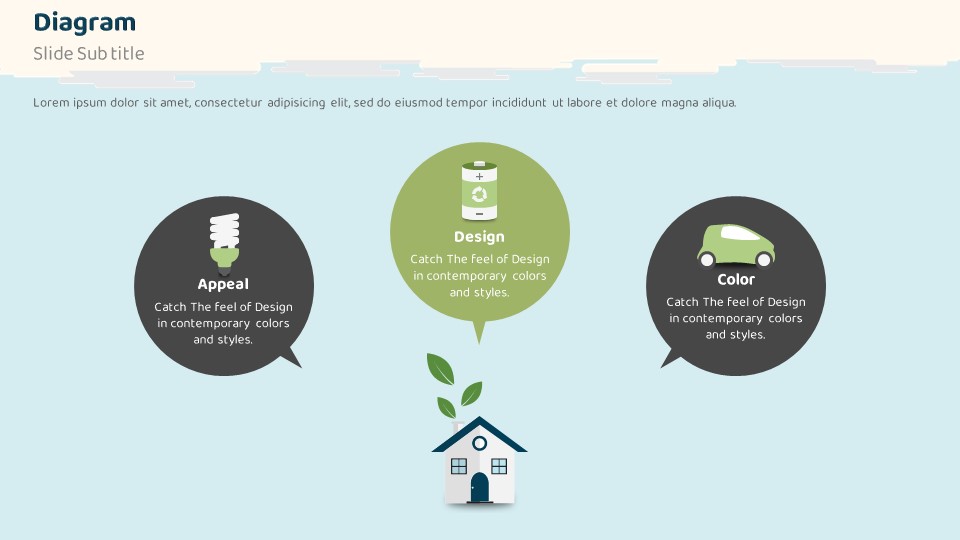
This PowerPoint template features flat illustrations of wind turbines, solar panels, and natural landscapes set against a sky blue background, making it ideal for eco-friendly energy and sustainability presentations. The 35-slide deck includes a wide variety of slide types: a title slide with nature illustration, clustered column charts, arrow diagrams, doughnut charts with EV and battery icons, a global map slide, and a four-quadrant icon diagram. The flat icon style communicates complex environmental data in an approachable and visually clear way, while the dark navy typography paired with green and white accents creates a trustworthy presentation atmosphere. Provided in fully editable PPTX format, you can replace text, chart data, and colors to match your content instantly. This presentation template is well-suited for corporate ESG reports, renewable energy business pitches, environmental campaigns, and academic research on sustainability topics.
Usage Points
-
Main Usage
Designed for corporate ESG reporting, renewable energy business pitches, environmental campaigns, and sustainability strategy presentations. The flat illustration style and data-rich slide variety make it easy to communicate complex environmental topics clearly and professionally.
-
How to Use
Open the PPTX file and replace placeholder text and chart data with your actual content. The clustered bar chart and doughnut chart slides are ideal for visualizing energy ratios and performance metrics, while the global map slide works perfectly for showing country-level environmental data.
-
Recommended For
Recommended for sustainability managers, ESG reporting teams, renewable energy startups preparing investor decks, environmental NGOs, and academics presenting research on climate or energy topics. Suitable for both internal reports and external stakeholder presentations.
-
Slide Structure
The 35-slide set includes a flat illustration title slide, clustered column chart, arrow diagram, Venn-style infographic, global map, doughnut charts with EV and battery icons, and a four-quadrant icon diagram — covering all key sections of an environmental or energy presentation.
Related Products
-

Mountain Presentation Template – Captivating Nature Visuals
#Nature/Travel
-

Ocean PowerPoint Wide Template - Captivating Underwater Beauty
#Nature/Travel
-

Zoo Tree Silhouette PowerPoint Template – Stylish Design Inspired by Nature
#Nature/Travel
-

Botanical Garden PPT Template – Nature-Inspired Design
#Nature/Travel
