Differentiation Strategy for Eco-Friendly Business – Real Product/Service Case
RJ0600029_30
- Last Update 06/28/2025
- File Size 0.4MB
- # of Slides 2
- File Format PPTX
- Slide Ratio 16:9
- Color
Keywords
- #Content-Based Slides
- #Design-Based Slides
- #Product/Service Introduction
- #Diagram
- #Differentiation Strategy for Products/Services
- #Development Plan
- #Cluster
- #Combination Diagram
- #16:9
- #Venn diagram PowerPoint
- #three-circle Venn diagram slide
- #overlapping diagram template
- #intersection diagram PowerPoint
- #relationship diagram slide template
About the Product
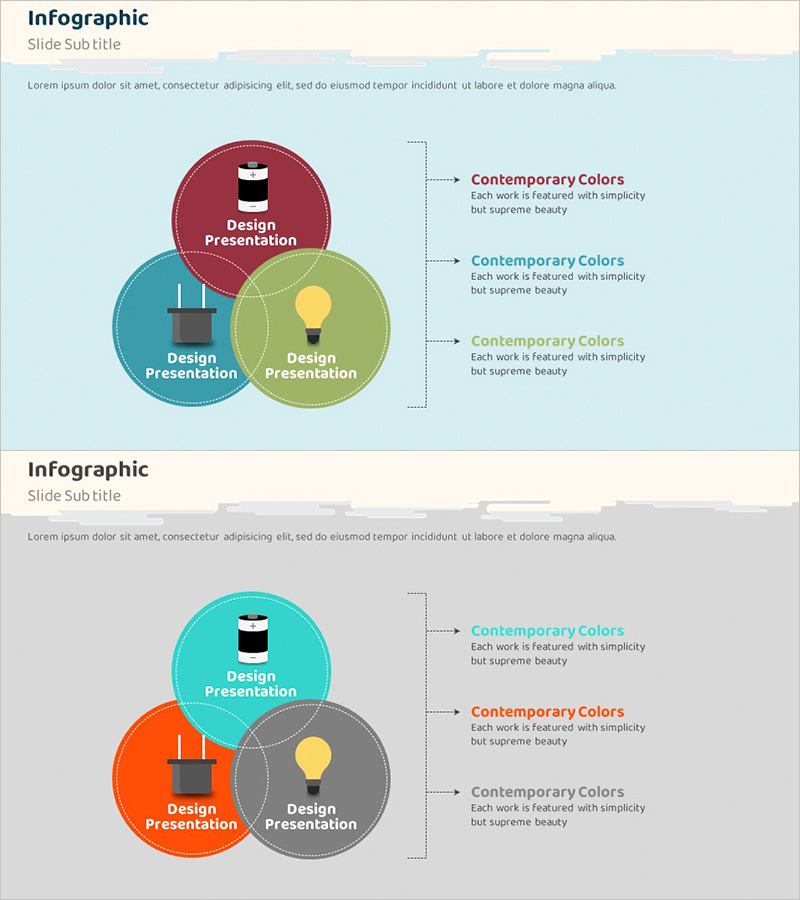
A three-circle Venn diagram PowerPoint slide that emphasizes intersection areas through overlapping circles. The first slide features wine-red, teal, and lime-green circles with icons and text labels, connected to explanation boxes via arrows on the right. The second slide uses the same structure with teal, orange, and gray color variations for flexible presentation scenarios. Each slide is optimized for visualizing relationships, intersections, and comparative analysis between products, services, and strategies, enabling clear communication of differentiation points in eco-friendly business contexts.
Usage Points
-
Main Usage
Visualizes intersections, commonalities, and differentiation factors among three elements. Ideal for analyzing eco-friendly business product-service-strategy relationships, competitive positioning, market analysis, cross-departmental collaboration structures, and value proposition mapping.
-
How to Use
Enter core concepts, department names, or product categories in each circle node. Add shared values, synergies, or differentiation points in the central intersection area. Complete the presentation by filling explanation boxes on the right with detailed descriptions, creating an intuitive flow for complex relationship mapping.
-
Recommended For
Strategic planning teams, marketing departments, business development units presenting differentiation strategies, product positioning analysis, organizational collaboration frameworks, competitive analysis reports, and business diversification strategy meetings.
-
Slide Structure
2-slide set. Slide 1: Three-circle Venn diagram in wine-red, teal, and lime-green with icons inside each circle, connected to three right-aligned explanation boxes via dotted arrows. Slide 2: Identical structure with teal, orange, and gray color variation. Central intersection area highlighted for emphasis.
Related Products
-

Academic Content Diffusion Overlay Diagram – Product Differentiation Strategy
#Product/Service Introduction #Diagram #Differentiation Strategy for Products/Services
-

Brain Science Learning Overlapping Diagram – An Innovative Approach to Learning
#Product/Service Introduction #Diagram #Text Box
-

Differentiated Promotion Strategy Presentation Template – Emphasizing Marketing and Innovation
#Product/Service Introduction #Marketing Plan and Strategy #Diagram
-

Overlap Diagram for Analysis and Strategy – Business Insights
#Product/Service Introduction #Business Vision and Strategy #Diagram
