Eco-Friendly Business Area Diagram – Sustainable Future
RJ0600029_13
- Last Update 06/28/2025
- File Size 0.4MB
- # of Slides 2
- File Format PPTX
- Slide Ratio 16:9
- Color
Keywords
About the Product
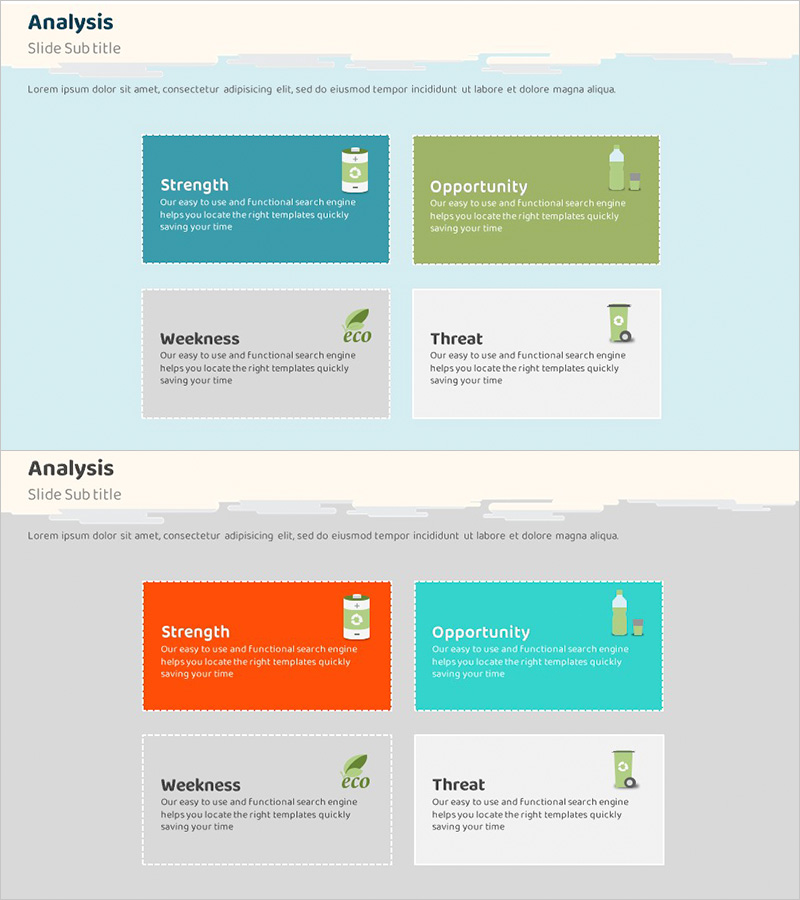
A 4-section cluster diagram PowerPoint slide structured as SWOT analysis framework. Divides business landscape into Strength, Opportunity, Weakness, and Threat quadrants, each color-coded for instant visual recognition. Features teal, olive-green, gray, and white sections with supporting icons on light blue header background. Includes descriptive text areas for detailed analysis. Ready-to-use presentation template for sustainability-focused business introductions and strategic planning discussions.
Usage Points
-
Main Usage
Visualizes business landscape analysis by organizing strategic factors into four distinct quadrants. Color differentiation enables quick comprehension of each element's category and relationship. Ideal for presenting sustainability initiatives, competitive positioning, and strategic recommendations in business planning and investor pitch contexts.
-
How to Use
Customize each quadrant title and descriptive text to match your business analysis. Input specific strengths, opportunities, weaknesses, and threats relevant to your organization. Modify icons or adjust color scheme as needed. Suitable for business plans, proposals, investor presentations, and strategic review meetings.
-
Recommended For
Business strategists, marketing planners, executives, startup founders, sustainability officers, CSR managers, management consultants, and business analysts presenting strategic analysis, competitive positioning, or sustainability initiatives.
-
Slide Structure
Header section with analysis title on light blue background. Four quadrants arranged in 2×2 grid: top-left teal (Strength with icon), top-right olive-green (Opportunity with icon), bottom-left gray (Weakness with icon), bottom-right white (Threat with icon). Each section features dashed border, title area, and descriptive text space.
Related Products
-

Designing a Project for Success – Business Concept Visualization
#Product/Service Introduction #Business Introduction #Diagram
-

Introduction to Hexagonal Frame Technology – Innovative Design
#Product/Service Introduction #Business Introduction #Diagram
-

Business Area Circular Diagram – Visualizing Cluster Information
#Company Introduction #Business Introduction #Diagram
-

Introduction to the Financial Business Program Slide Template – Design Reflecting Professionalism and Innovation
#Product/Service Introduction #Business Introduction #Diagram
