Donut Chart of Causes of Environmental Pollution – Visualization of Data Analysis
RJ0600029_29
- Last Update 06/28/2025
- File Size 0.4MB
- # of Slides 2
- File Format PPTX
- Slide Ratio 16:9
- Color
Keywords
About the Product
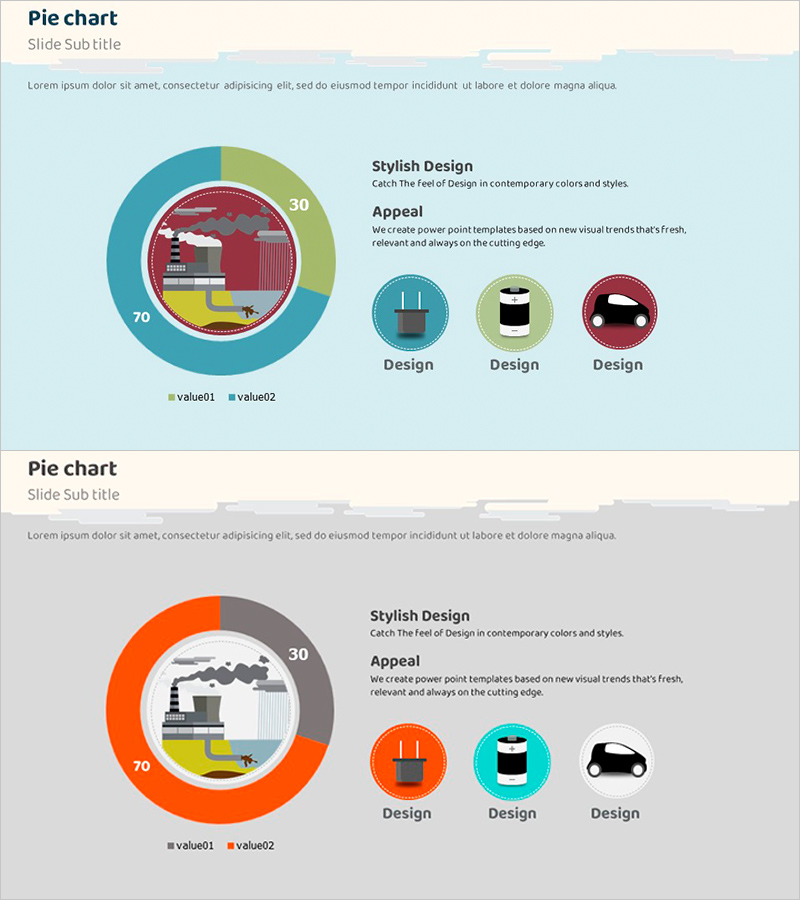
A donut chart PowerPoint slide designed for environmental pollution cause analysis and data visualization. The donut graph features teal and lime color series with a 70:30 ratio display, incorporating an icon illustration in the central circular area to enhance data meaning. The right section includes 'Stylish Design' and 'Appeal' text areas for comprehensive information delivery. Two slide variations with color options (teal and orange) allow flexible adaptation to presentation tone. Provided in 16:9 widescreen PPTX format, fully editable for immediate use.
Usage Points
-
Main Usage
Visualizes ratio-based data analysis results using a donut chart format. Clearly presents the composition of two major categories such as environmental factors, market segments, or customer demographics. The central icon area intuitively communicates the data topic.
-
How to Use
Insert into marketing plans, business reports, or analysis documents in the 'Market Analysis' or 'Current Status' section. Double-click the chart values to input actual data, replace the central icon to match your topic, and add summary text in the right text box to complete the slide.
-
Recommended For
Data analysts, marketing professionals, and business executives preparing reports benefit most from this template. Ideal for environmental or energy analysis presentations, customer segmentation studies, product composition explanations, and any situation requiring ratio-based insights.
-
Slide Structure
Two-slide set with teal and orange color variations. Each slide contains a donut-shaped pie chart (2-segment, 70:30 ratio labeled), central circular icon area, and right-side text box with title, description, and three design elements. 16:9 widescreen format in PPTX; all elements fully editable.
Related Products
-

Status Analysis Donut Chart – Shareholder Status Analysis
#Company Introduction #Market and Competitor Analysis #Diagram
-

Shareholder Status Distribution Analysis Chart – Visualizing Shareholder Information
#Company Introduction #Market and Competitor Analysis #Diagram
-

Paint Splash Bar Chart Template – Market Analysis and Strategy
#Market and Competitor Analysis #Marketing Plan and Strategy #Graph
-

Survey and Poll Analysis Graphs – Optimized for Market Analysis
#Market and Competitor Analysis #Diagram #Graph
