Eco-friendly Eco Horizontal Bar Graph - Market Competition Analysis
RJ0600029_21
- Last Update 06/28/2025
- File Size 0.4MB
- # of Slides 2
- File Format PPTX
- Slide Ratio 16:9
- Color
Keywords
About the Product
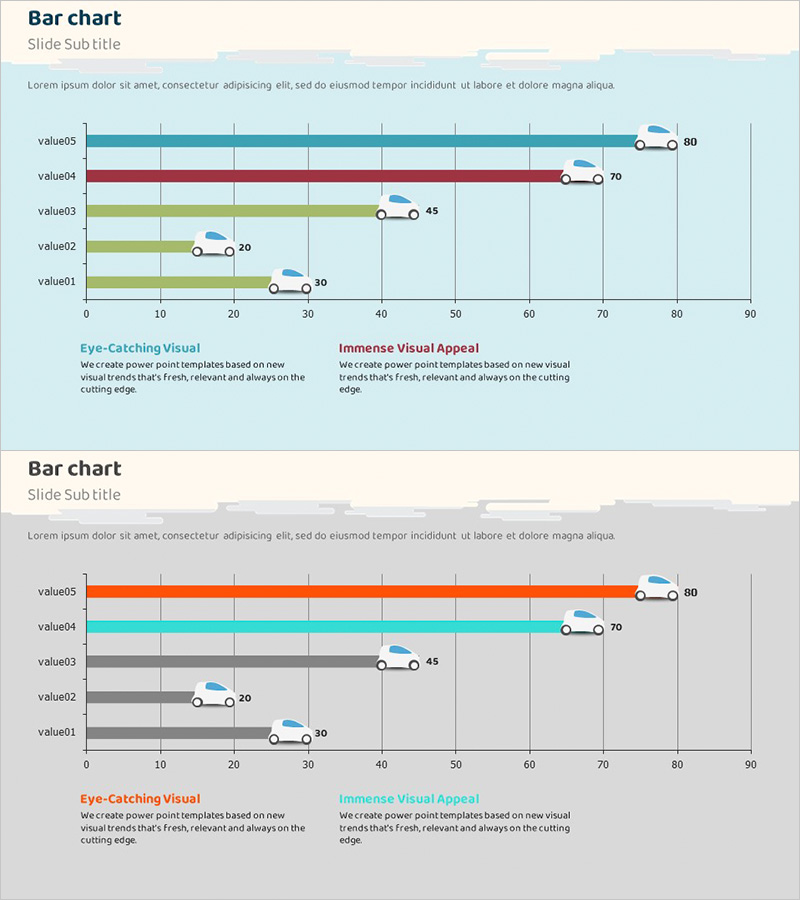
A horizontal bar chart PowerPoint slide optimized for market competition analysis and numerical comparisons featuring five data items. The eco-friendly color palette includes light blue, orange, cyan, and gray tones that convey sustainability messaging while maintaining visual clarity. Each slide presents the same data structure with different color combinations, allowing flexible emphasis strategies. Car icons add visual context for transportation and logistics presentations. The 2-slide deck is formatted for 16:9 widescreen and ready for immediate use in business reports and presentations.
Usage Points
-
Main Usage
Designed to compare five data items side-by-side using horizontal bars, ideal for market competition analysis, sales volume comparison, and performance metrics. The eco-friendly color scheme makes it particularly suitable for sustainability, environmental, and corporate responsibility presentations.
-
How to Use
Modify bar lengths and numerical values to input your actual data. Slide 1 uses light blue, orange, and cyan combinations; Slide 2 employs gray tones for alternative emphasis. Car icons can be retained for transportation and logistics contexts or removed for general business use.
-
Recommended For
Marketing plans, business reports, market analysis presentations, executive summaries, competitive positioning slides, and industry-specific decks for automotive, logistics, energy, and environmental sectors.
-
Slide Structure
Two slides with five data items (value01–value05) each. Horizontal axis ranges from 0 to 90 with gridlines for precise value reading. Slide 1: Multi-color arrangement (light blue, orange, cyan, gray). Slide 2: Unified gray-tone palette for alternative visual emphasis.
Related Products
-

Navy Orange Comparison Bar Graph
#Market and Competitor Analysis #Graph #Competitor Analysis
-

Agricultural Competitor Analysis Horizontal Bar Chart
#Market and Competitor Analysis #Graph #Competitor Analysis
-

Ticket Sales Graph – Visualizing Competitive Edge
#Market and Competitor Analysis #Graph #Competitor Analysis
-

Horizontal Bar Chart for Competitive Advantage Analysis – Sea Lighthouse
#Market and Competitor Analysis #Diagram #Graph
