Environmental Pollution Infographic Table Template
RJ0600029_27
- Last Update 06/28/2025
- File Size 0.4MB
- # of Slides 2
- File Format PPTX
- Slide Ratio 16:9
- Color
Keywords
- #Content-Based Slides
- #Design-Based Slides
- #Financial Plans and Performance
- #Diagram
- #Projected Return on Investment (ROI)
- #Budget
- #Table
- #16:9
- #environmental pollution table PowerPoint
- #environmental data slide design
- #pollution metrics table
- #sustainability presentation slide
- #how to create data table in PowerPoint
About the Product
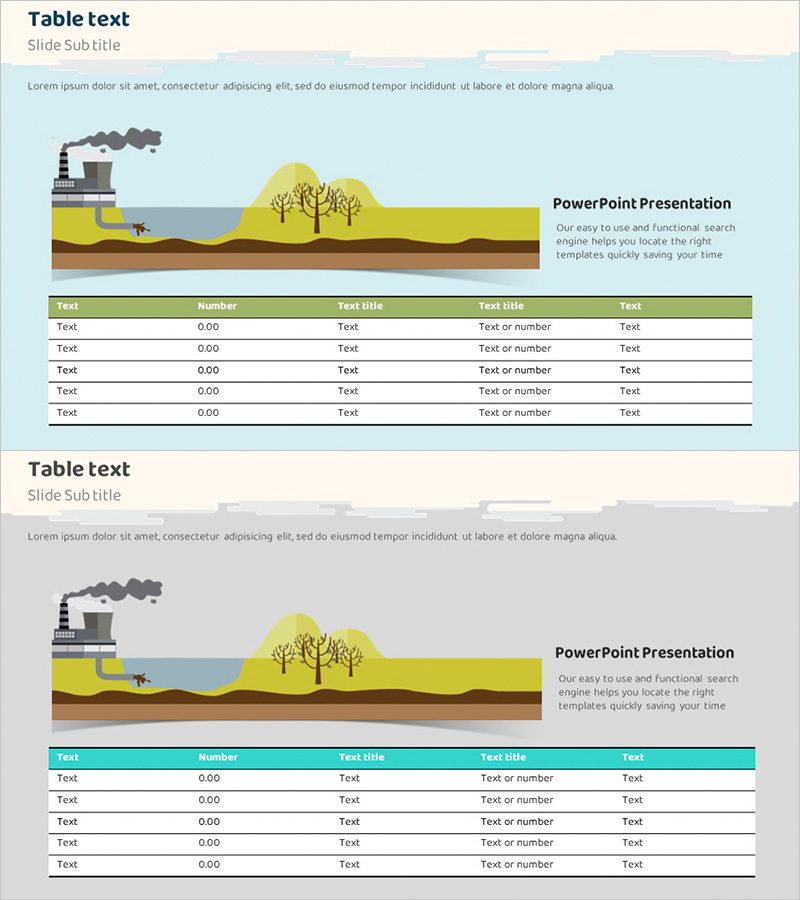
A PowerPoint table slide that visualizes environmental pollution data with numerical indicators. The design features a two-color scheme with green and gray headers, providing clear data readability across five input rows for pollution metrics, values, and descriptions. The top section includes environmental illustrations (factory, trees, river) that reinforce the subject context. Available in 16:9 PPTX format for immediate editing, this slide is ideal for environmental reports, sustainability presentations, policy proposals, and stakeholder communications that require data-driven credibility.
Usage Points
-
Main Usage
This slide clearly presents environmental pollution metrics, indicators, and numerical data in structured table format. It enables effective communication of quantitative information such as factory emissions, air quality indices, and water pollution levels to decision-makers and stakeholders with credibility.
-
How to Use
The environmental illustration at the top reinforces the subject context. Enter column headers (e.g., pollution source, region, value, unit, status) in the green header row. Fill the five data rows with specific metrics to create a comparable and analyzable format. Use in environmental policy documents, sustainability reports, and ESG disclosures.
-
Recommended For
Environmental officers, policy makers, sustainability managers, environmental consultants, NGO professionals, and academic researchers benefit from this slide when analyzing environmental conditions, proposing policies, and preparing reports. Enhances data credibility in government reports, corporate ESG disclosures, and environmental seminars.
-
Slide Structure
Two-slide set with the first featuring a green header, gray background, and 5-row table; the second with a teal header, gray background, and 5-row table. Both slides include environmental illustrations (factory, trees, river) at the top and text area on the right, creating clear information hierarchy.
Related Products
-

Marketing Budget Analysis Table – Efficient Budget Allocation
#Financial Plans and Performance #Diagram #Projected Return on Investment (ROI)
-

Medical Business Expected Funding Requirements Table – Efficient Financial Planning
#Financial Plans and Performance #Diagram #Projected Return on Investment (ROI)
-

Potential and Plans for Attracting Additional Investment - Projected ROI and Strategic Budget Analysis
#Financial Plans and Performance #Diagram #Projected Return on Investment (ROI)
-

Expected Investment Return Calculation Slide
#Financial Plans and Performance #Diagram #Projected Return on Investment (ROI)
