Survey on preferences for eco-friendly practices
RJ0600029_32
- Last Update 06/28/2025
- File Size 0.4MB
- # of Slides 2
- File Format PPTX
- Slide Ratio 16:9
- Color
Keywords
About the Product
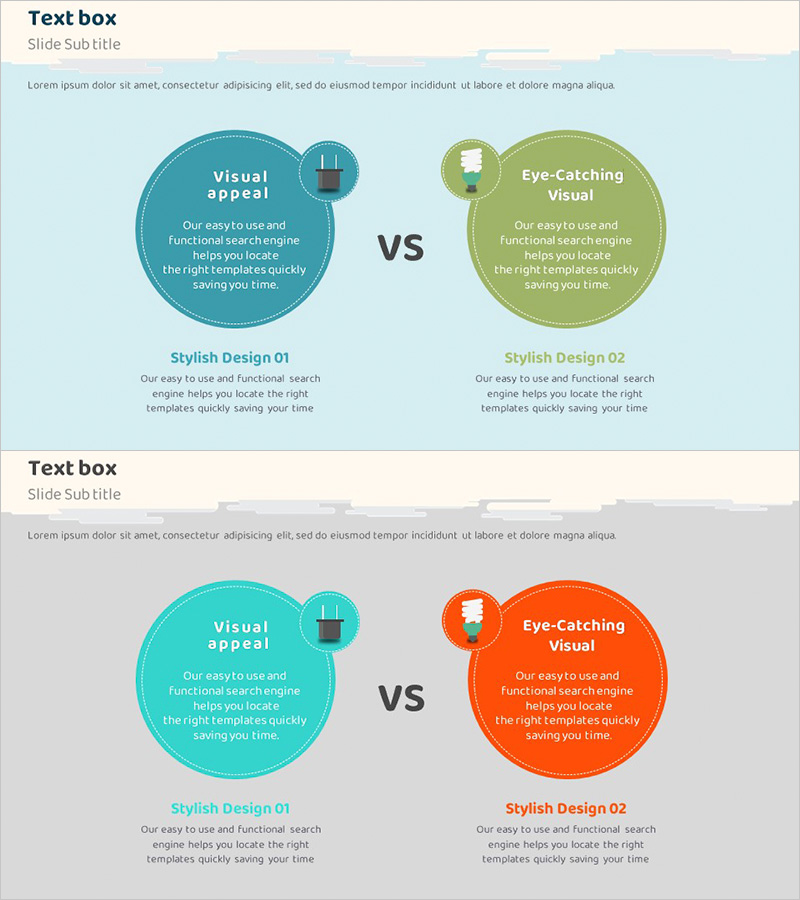
A PowerPoint slide comparing two competitive advantages or market preferences using a two-circle diagram layout. The left circle features a blue tone while the right circle uses a green tone, creating strong visual contrast. Each circle includes space for an icon, title, and descriptive text. Optimized for 16:9 widescreen format in a 2-slide set, this template is ready for immediate use in strategy presentations, competitive analysis, product differentiation, and customer preference studies. Fully editable PPTX format allows you to customize colors, text, and icons to match your brand identity.
Usage Points
-
Main Usage
This slide visualizes competitive advantages or market preferences by comparing two key items side-by-side using circular diagrams. It effectively communicates survey results, product comparisons, or strategic differentiators through color-coded visual contrast, making complex competitive analysis immediately understandable to stakeholders.
-
How to Use
Enter your comparison items in the left and right circle sections, adding titles, descriptions, and icons to each. Customize the background colors (blue/green) and text formatting to align with your corporate branding. Use the central 'VS' text to emphasize the comparative relationship. Insert this slide in business strategy decks, marketing plans, investor pitches, or competitive analysis sections.
-
Recommended For
Marketing managers, business strategists, investment pitch presenters, and market research analysts. Ideal for sustainability-focused companies, product differentiation presentations, customer preference surveys, and competitive positioning reports.
-
Slide Structure
Two-slide set with each slide featuring a title and description area at the top, followed by two circular diagrams in the center. The left circle (blue tone) and right circle (green tone) each contain 3-4 text input areas for icons, titles, and descriptions, with a central 'VS' label emphasizing the comparison.
Related Products
-

Area Graph – Effective Visualization for Market and Competitor Analysis
#Market and Competitor Analysis #Graph #Other
-

Carbon Neutral Competitive Advantage Horizontal Chart
#Market and Competitor Analysis #Graph #Competitor Analysis
-

Soccer Match Silhouette – Market Analysis and Competitive Advantage
#Operational Plan #Market and Competitor Analysis #Text Box
-

Business Competitive Advantage Analysis Graph – Differentiation in the Market
#Market and Competitor Analysis #Diagram #Graph
