Competitor and Target Research Chart – Market Analysis and Competitive Advantage
RJ0600029_25
- Last Update 06/28/2025
- File Size 0.5MB
- # of Slides 2
- File Format PPTX
- Slide Ratio 16:9
- Color
Keywords
- #Content-Based Slides
- #Design-Based Slides
- #Market and Competitor Analysis
- #Diagram
- #Market Analysis
- #Competitive Advantage
- #Table
- #Standard Table
- #16:9
- #radial chart PowerPoint
- #circular diagram slide template
- #ratio visualization
- #market analysis chart
- #competitor analysis PPT
- #data table slide design
About the Product
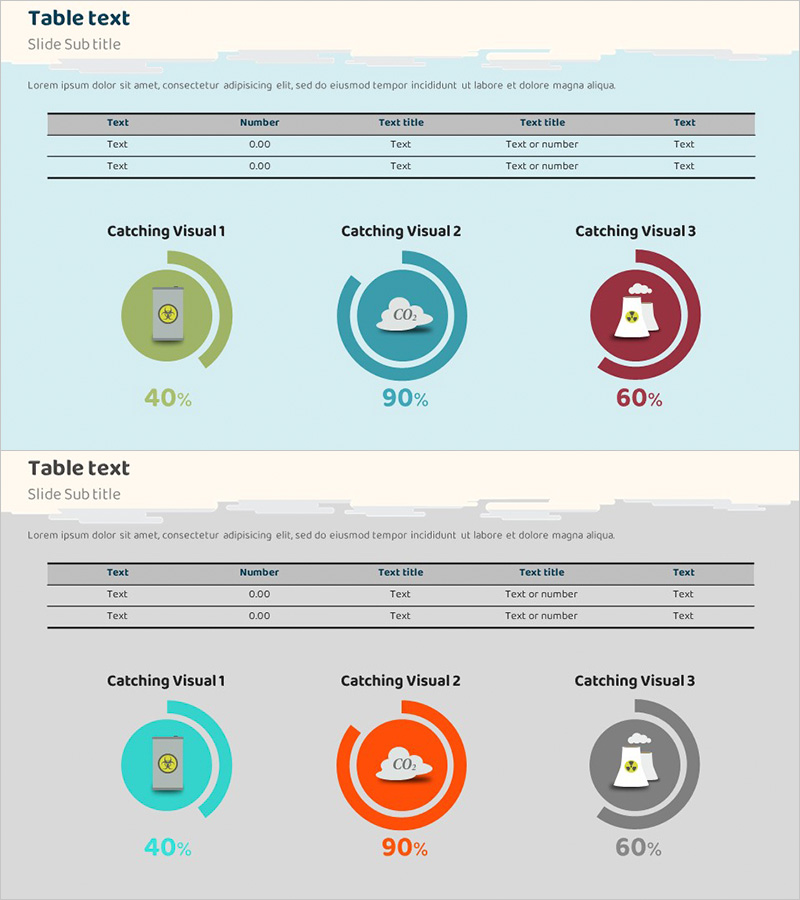
A radial chart PowerPoint slide set designed for market analysis and competitive advantage assessment. This 2-slide presentation template combines light blue, turquoise, and wine red color schemes to visualize competitor research, target market segmentation, and performance metrics. Each slide integrates a data table with circular diagrams to communicate both numerical information and proportional relationships simultaneously. Available in 16:9 widescreen PPTX format with fully editable elements, ready for corporate reports, strategic presentations, and marketing planning documents.
Usage Points
-
Main Usage
Visualize competitive strengths and weaknesses, segment target markets, and compare product or service performance metrics. The combination of circular diagrams and numerical tables delivers both quantitative evidence and visual impact for data-driven decision making.
-
How to Use
Insert into business plans, marketing strategy documents, or quarterly performance reports in the market analysis section. Replace table values with your company data and update chart ratios automatically for presentation-ready materials.
-
Recommended For
Executive teams, marketing departments, and sales teams conducting strategic meetings and external presentations. Ideal for new business planning, competitive analysis, and market positioning discussions in corporate environments.
-
Slide Structure
Slide 1: Light blue background with 5×5 data table and left-aligned radial chart showing 3 items (40%, 90%, 60% representation). Slide 2: Turquoise and wine red background variants with identical table and chart structure. Both slides include title and subtitle areas.
Related Products
-

Business Note Analysis Circle Graph & Table – Market and Competitive Analysis
#Market and Competitor Analysis #Diagram #Graph
-

Sensuous Cloud Presentation Template with World Map
#Market and Competitor Analysis #Diagram #Other
-

Key Competitive Factors in Market Analysis – First Step Toward Competitive Advantage
#Market and Competitor Analysis #Diagram #Graph
-

Drug Addiction Risk Analysis Graph Chart – Insightful Information Delivery
#Market and Competitor Analysis #Diagram #Graph
