Eco-friendly Light Bulb Pie Chart – Market Share Analysis
RJ0600029_24
- Last Update 06/28/2025
- File Size 0.4MB
- # of Slides 2
- File Format PPTX
- Slide Ratio 16:9
- Color
Keywords
About the Product
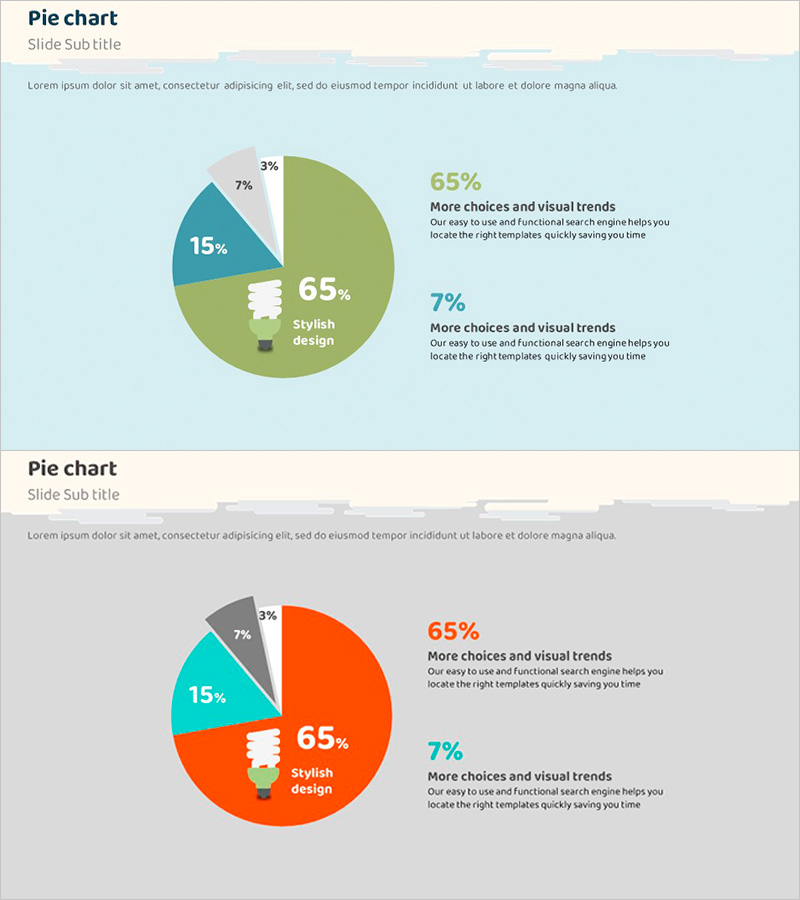
A 4-segment pie chart PowerPoint slide designed for eco-friendly light bulb market analysis. The circular graph features lime green, turquoise, gray, and white color segments representing market share distribution. Each section displays percentage values and descriptive text, enabling both data visualization and insight communication. This 2-slide template set is ready for immediate use in sustainability, environmental impact, and market analysis presentations.
Usage Points
-
Main Usage
Visualizes proportional relationships such as market share, sales distribution, customer composition, and product breakdown using a circular graph format. The 4-segment pie chart effectively compares major categories, while percentage labels on each section strengthen quantitative data delivery and audience comprehension.
-
How to Use
Use this slide in marketing reports, business analysis presentations, and investor pitch decks to explain market conditions. Add interpretation, insights, and action items to the text area on the right side of each slide to build data-driven storytelling and support strategic recommendations.
-
Recommended For
Marketing professionals, executives, analysts, consultants, and employees in environmental and energy sectors preparing market analysis, competitive benchmarking, and customer segmentation materials. Ideal for strategy development and reporting in sustainability-focused industries.
-
Slide Structure
2-slide set: Slide 1 features a lime green background with 4-segment pie chart (65%, 15%, 7%, 3% distribution); Slide 2 uses an orange background with identical chart structure. Both slides employ a 2-column layout with chart on left and text area on right, balancing data visualization with explanatory content.
Related Products
-

City and Nature Pie Chart Statistics – Visualization of Market Status
#Market and Competitor Analysis #Graph #Market Status
-

Market Targets and Status Chart – Visually Appealing Insights
#Market and Competitor Analysis #Graph #Market Status
-

Pie Chart for Oriental Medicines Market Overview
#Market and Competitor Analysis #Graph #Market Status
-

Pie Chart Slide Visualizing Transportation Status
#Market and Competitor Analysis #Graph #Market Status
